Hey everyone, Welcome to the anti-debugging series, Very recently i started learning about these concepts and its always better to document our learning which can be beneficial for others too. So I will be sharing this via some blogs, so lets get started :)
What really is Anti-debugging??
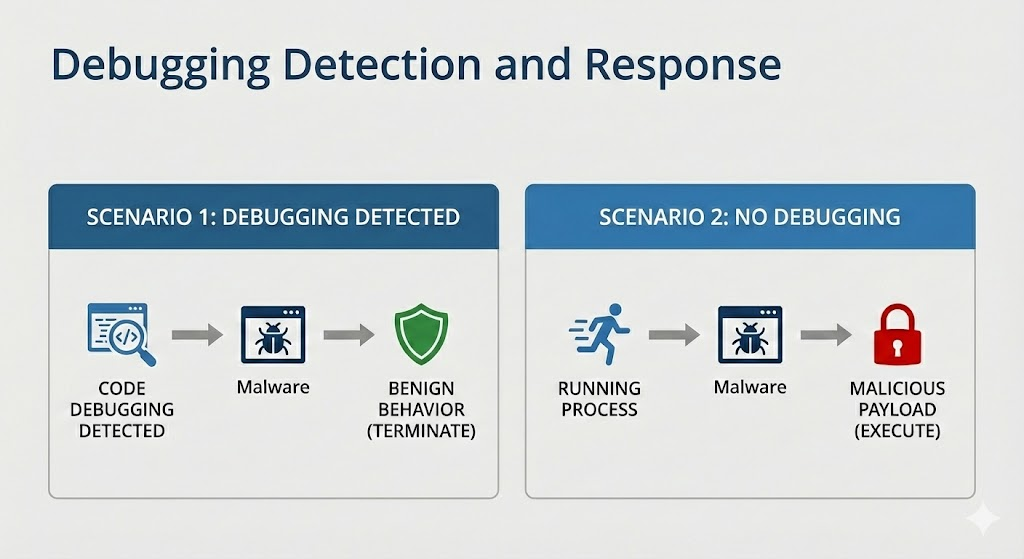
So, Anti-debugging means putting code inside a program that tries to detect if someone is debugging it, and behaves differently (or stops) if it detects one.
And btw a debugger is a tool used to inspect and step through code while it’s running. Anti-debugging tries to make that hard or obvious.

There are some use cases of anti-debugging
- Software companies protecting intellectual property
- Malware trying to hide from analysts
- Hackers trying to stop reverse-engineering
Core Classes (Types) of Anti-Debugging
Each one checks for different signs that a debugger is present, we will discuss them one by one throughout this series.
Anti-Debugging Methods
│
├─ API-Based
├─ Exception-Based
├─ Process & Thread Block
├─ Modified Code
├─ Hardware & Register
└─ Timing & Latency
API-Based Anti-Debugging
API stands for Application Programming Interface and these are Functions provided by the operating system to access the services and resources provided by the OS.
we will be focused on the Microsoft Windows operating system API
These are function calls Provided by windows that check for a debugger:
IsDebuggerPresent()
Checx`
IsDebuggerPresent
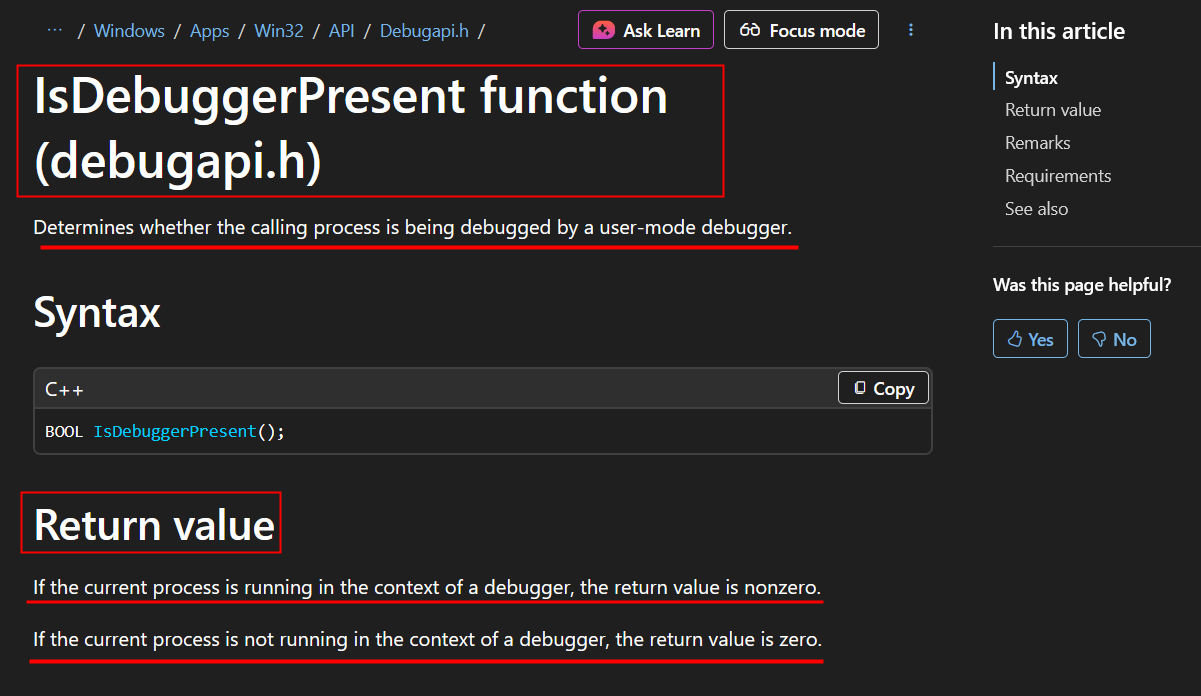
When learning about anti-debugging, we first get introduced to the IsDebuggerPresent() function. This function analyzes the process block of a target process to determine if the processes is running under the context of a debugging session.
Process Block???! whats that
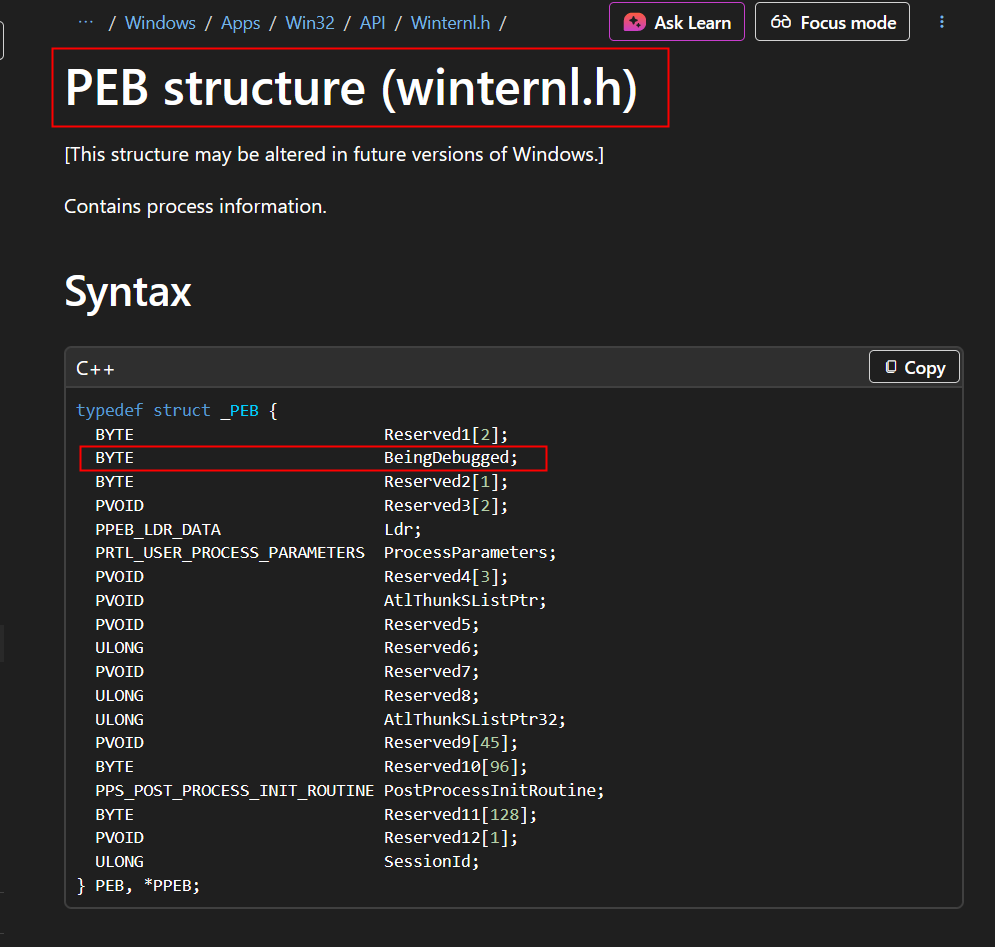
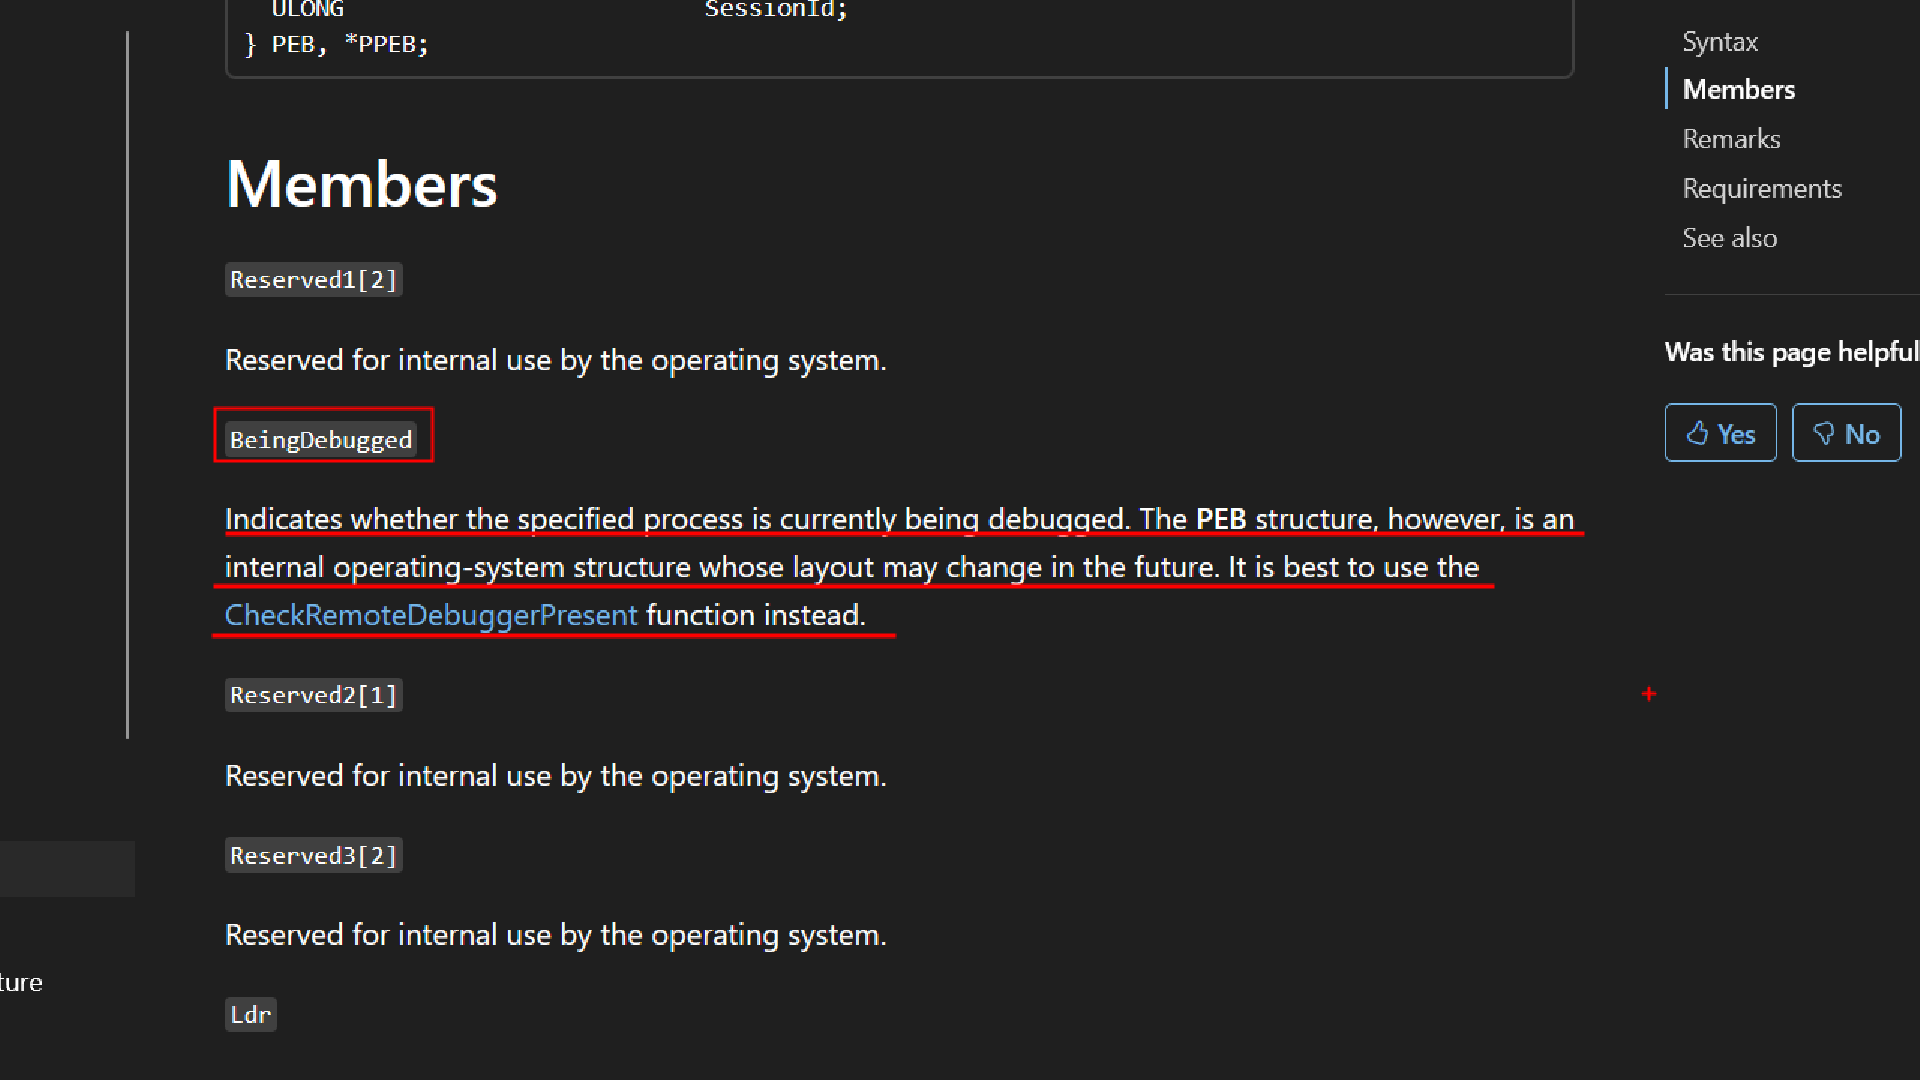
In Windows, every running program has a special internal structure called the Process Environment Block (PEB) .
The operating system maintains this structure for each process. and in the image below you can see a field called BeingDebugged this is important for us.
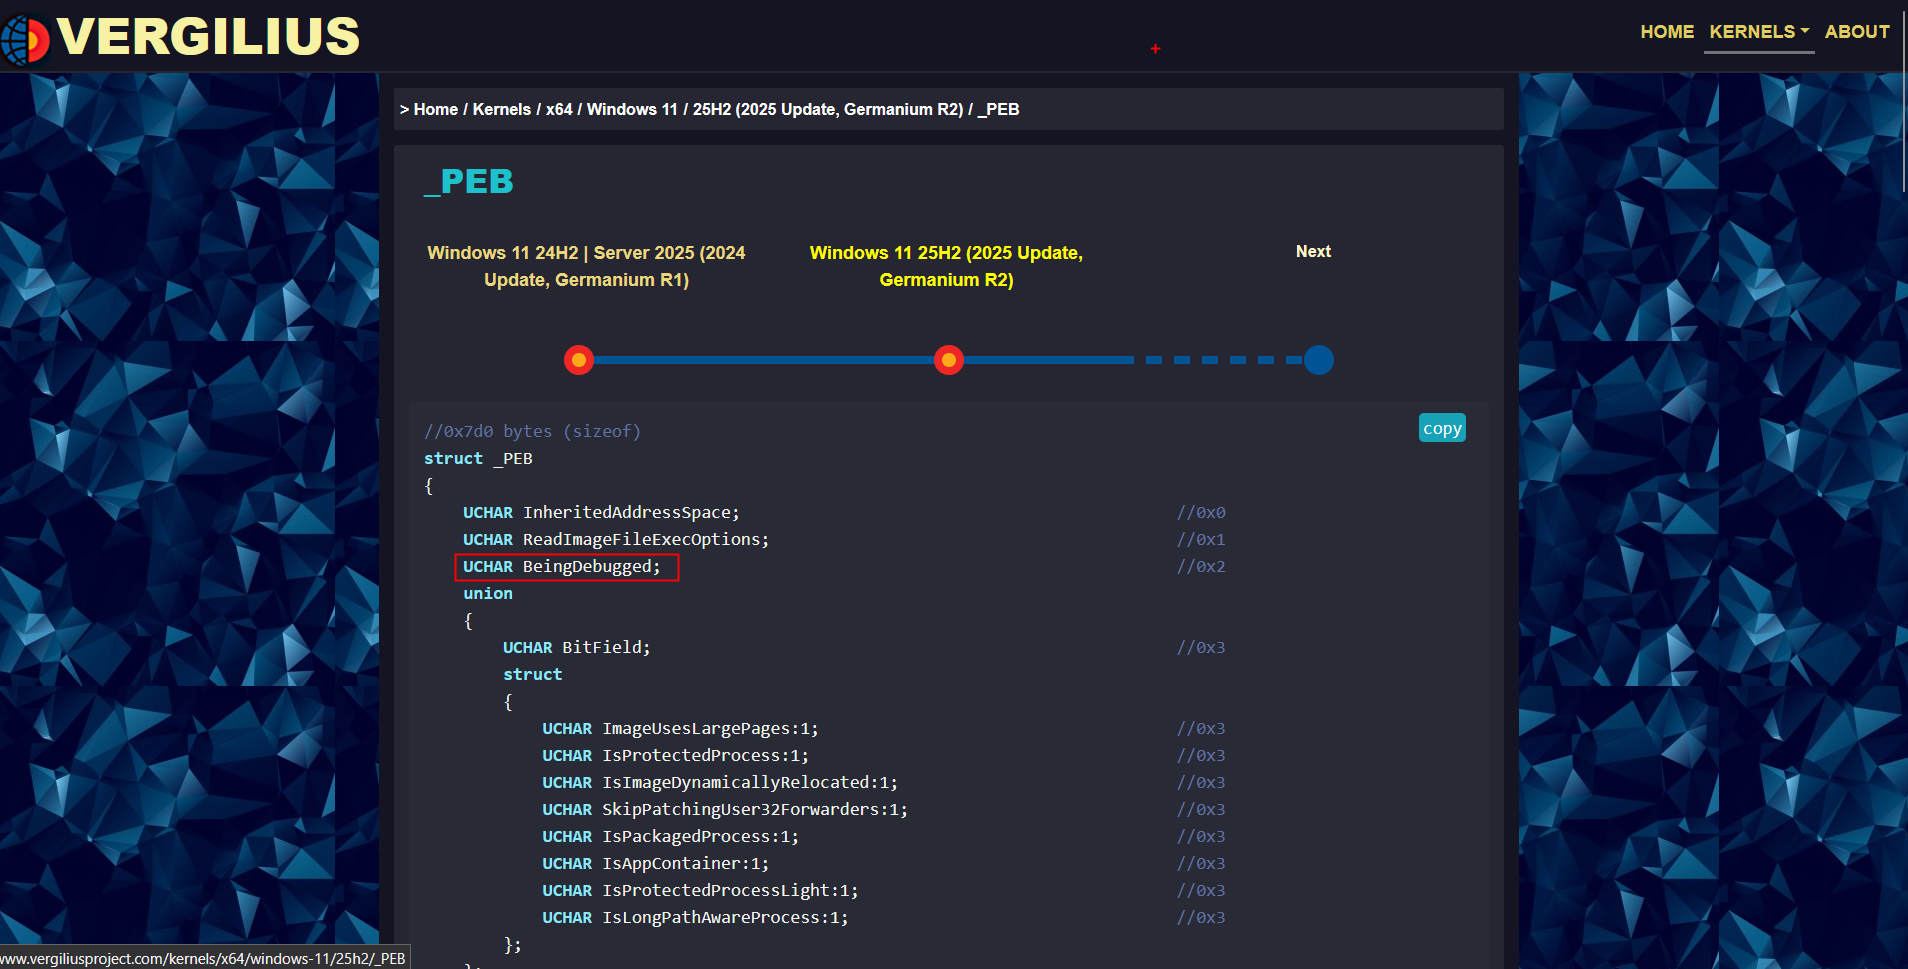
And btw there is something called as the Vergilius Project which is a community-driven repository that exposes the raw, internal structures of Windows kernels. We can see the members of the PEB here so we will be using this as reference.
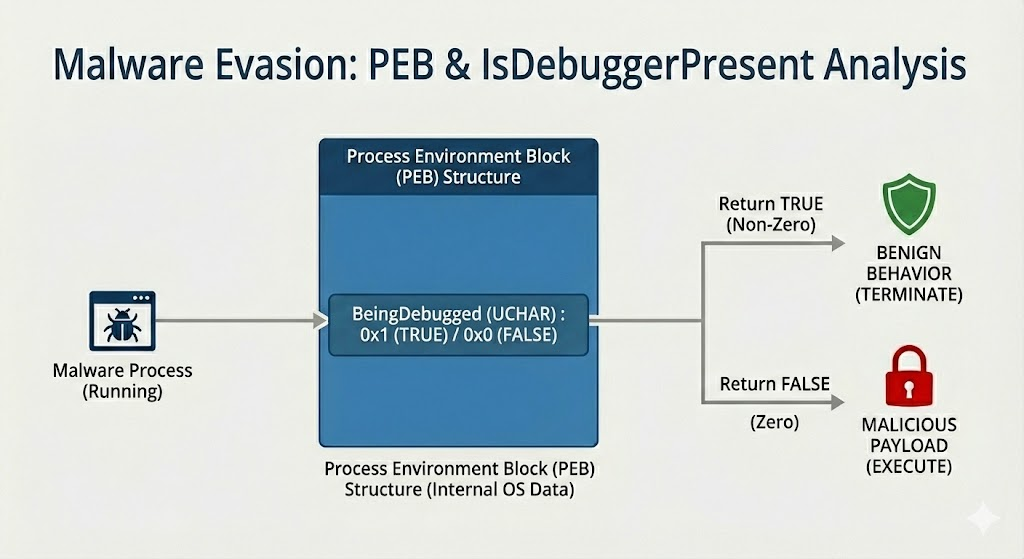
So, When a Program calls IsDebuggerPresent
//Prototype: BOOL WINAPI IsDebuggerPresent(void);


if (IsDebuggerPresent()) {
    // Debugger Detected - Do Something Here
} else {
    // No Debugger Detected - Continue
}
Enough theory Lets see this in action!
https://www.virustotal.com/gui/file/8fc9e35142a017e3cdd1b1941fc2f8db1d0f5c3c203f322f64c5f50f0507df0d
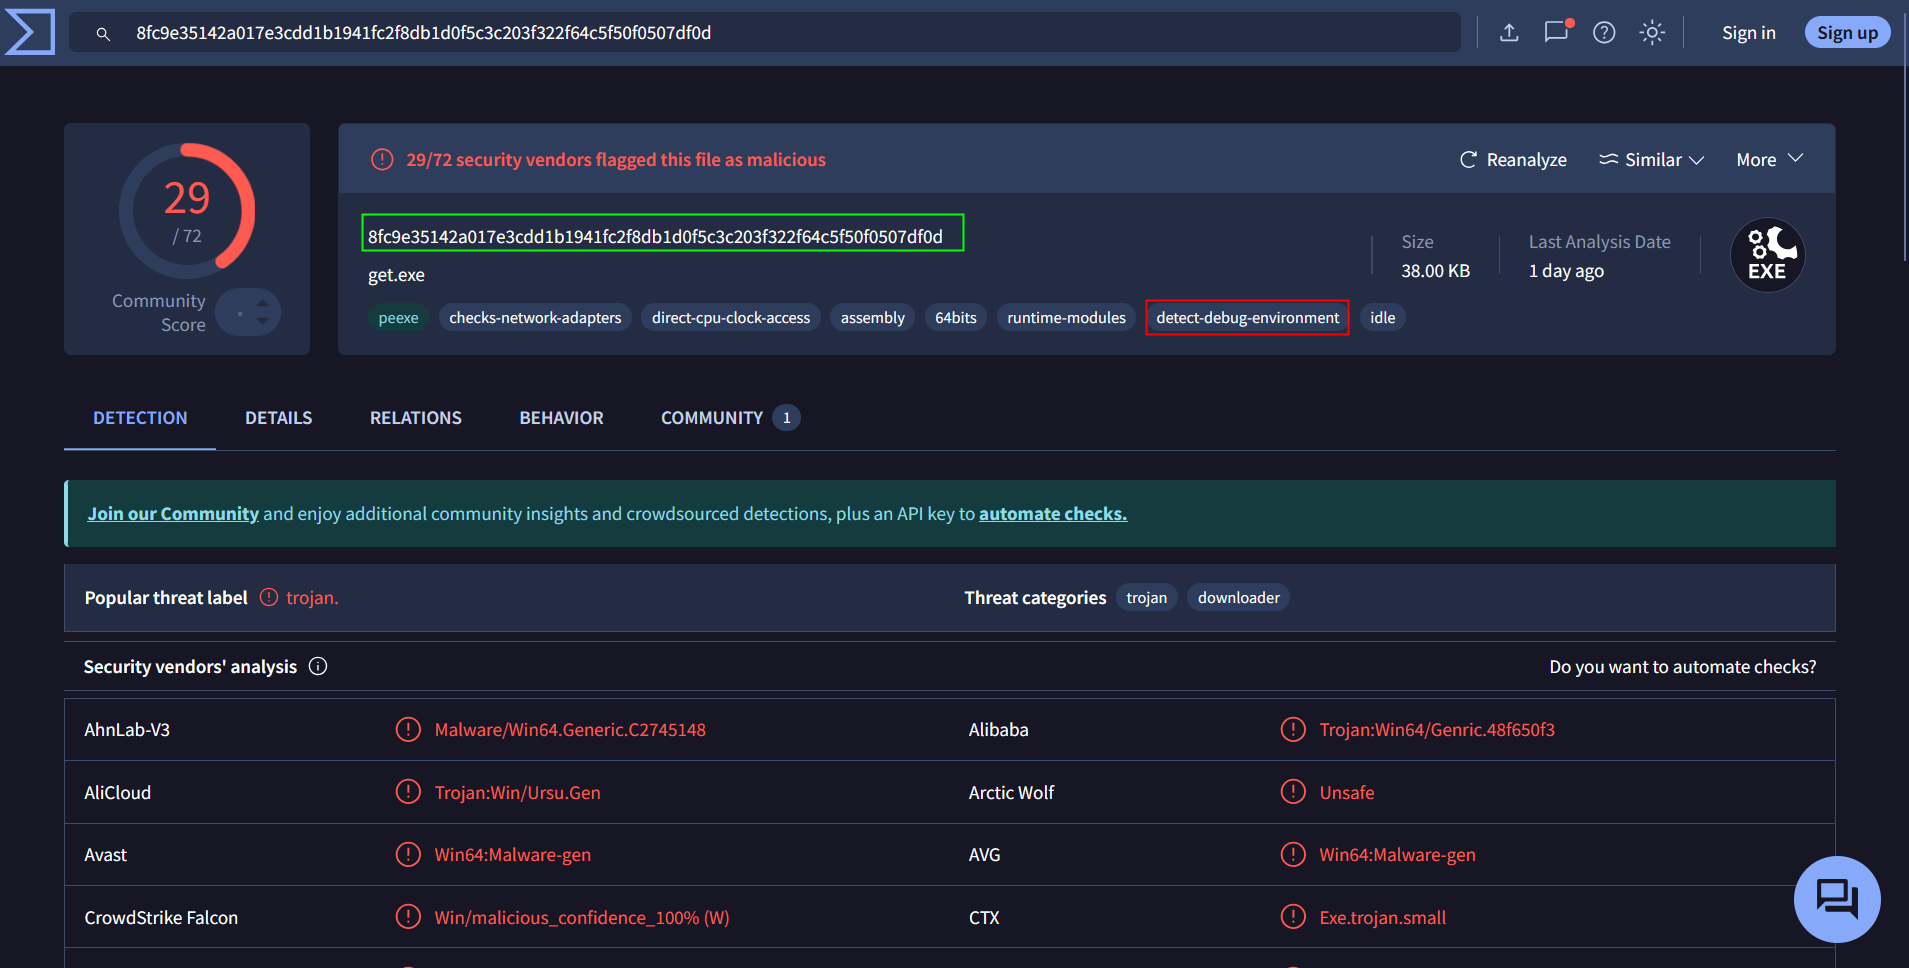
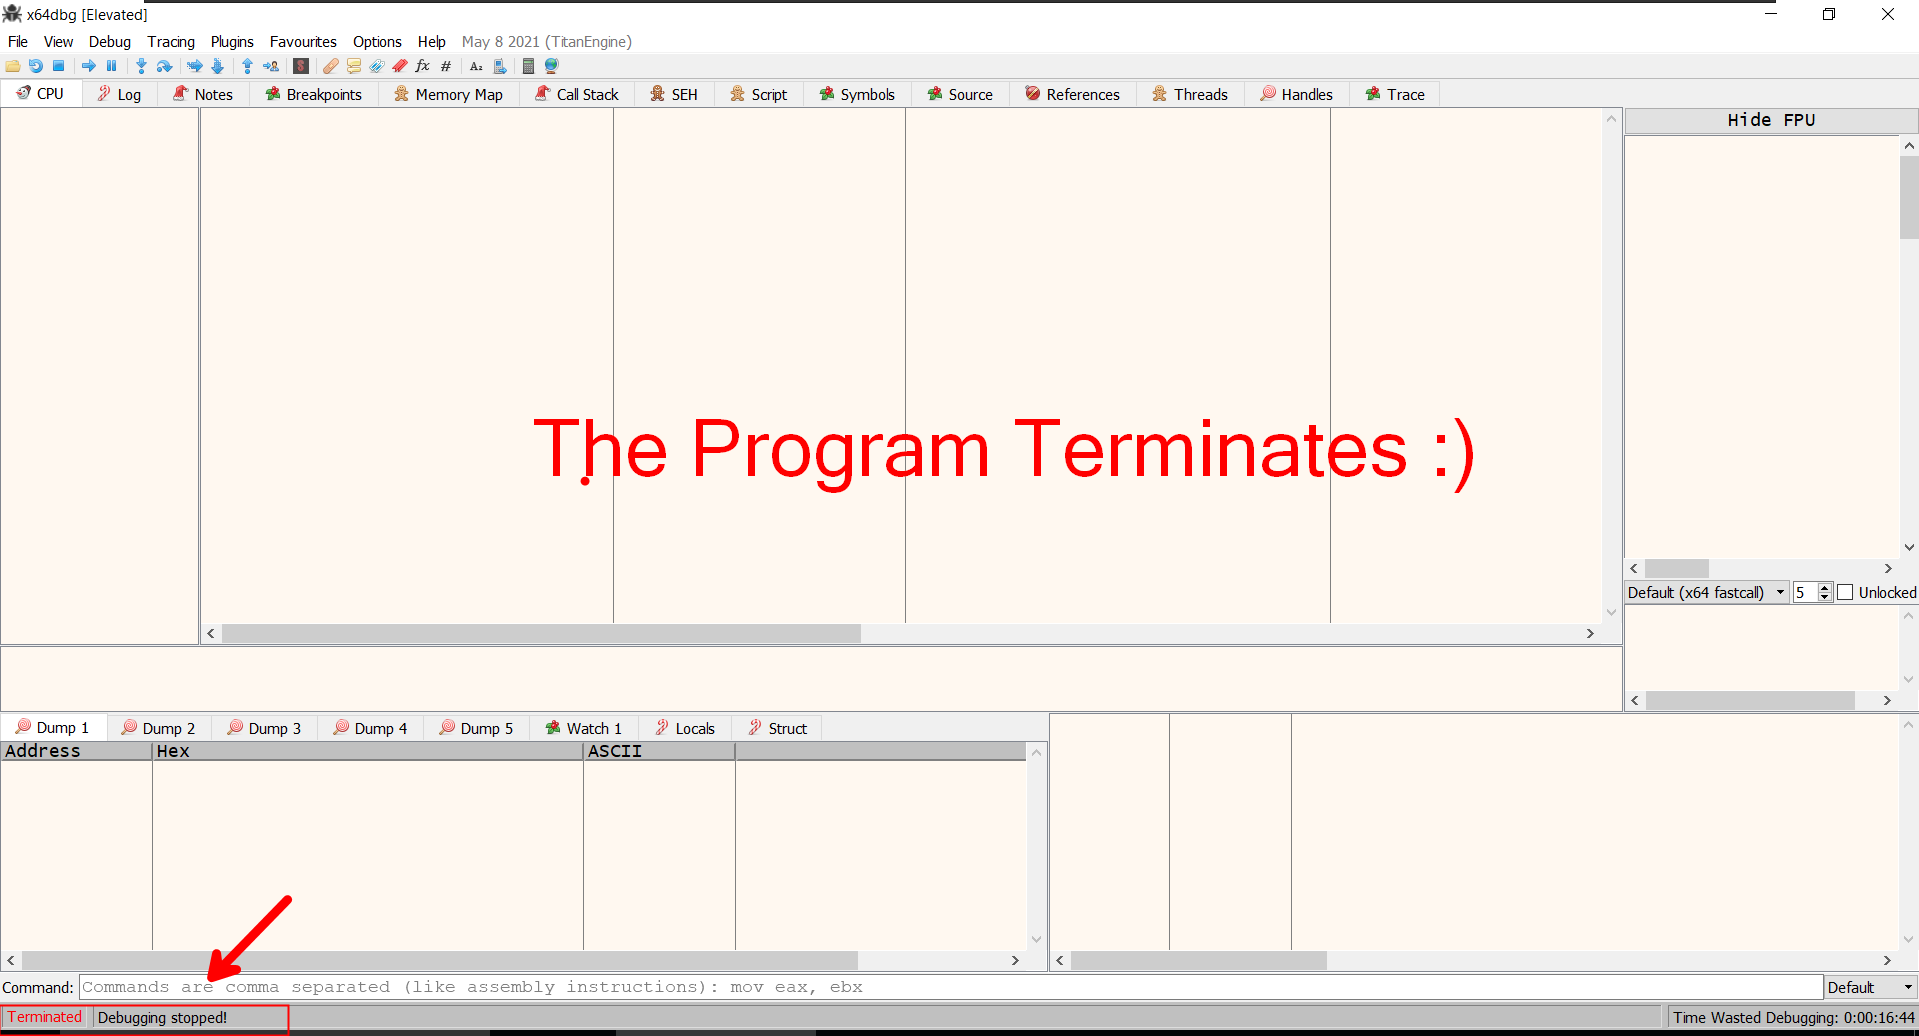
So this malware detects the debug-environment, lets load this malware inside the debugger
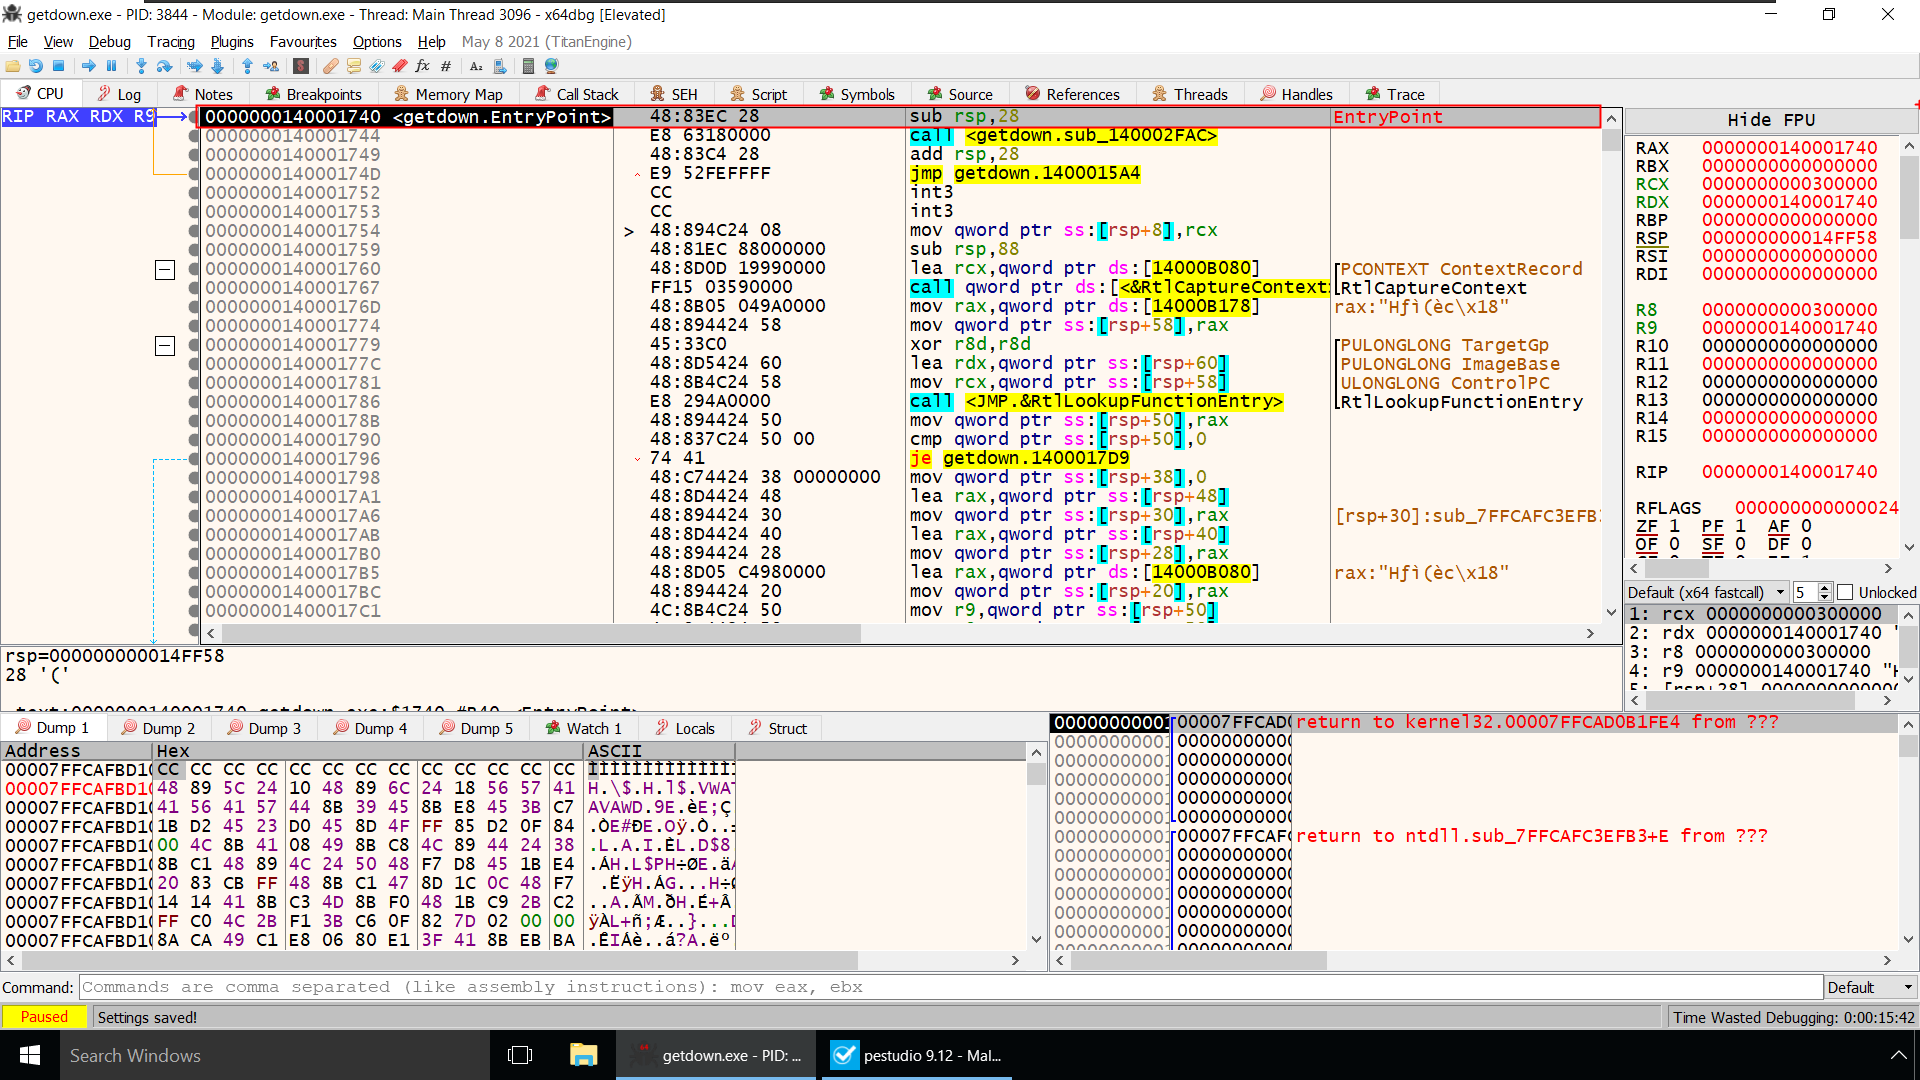
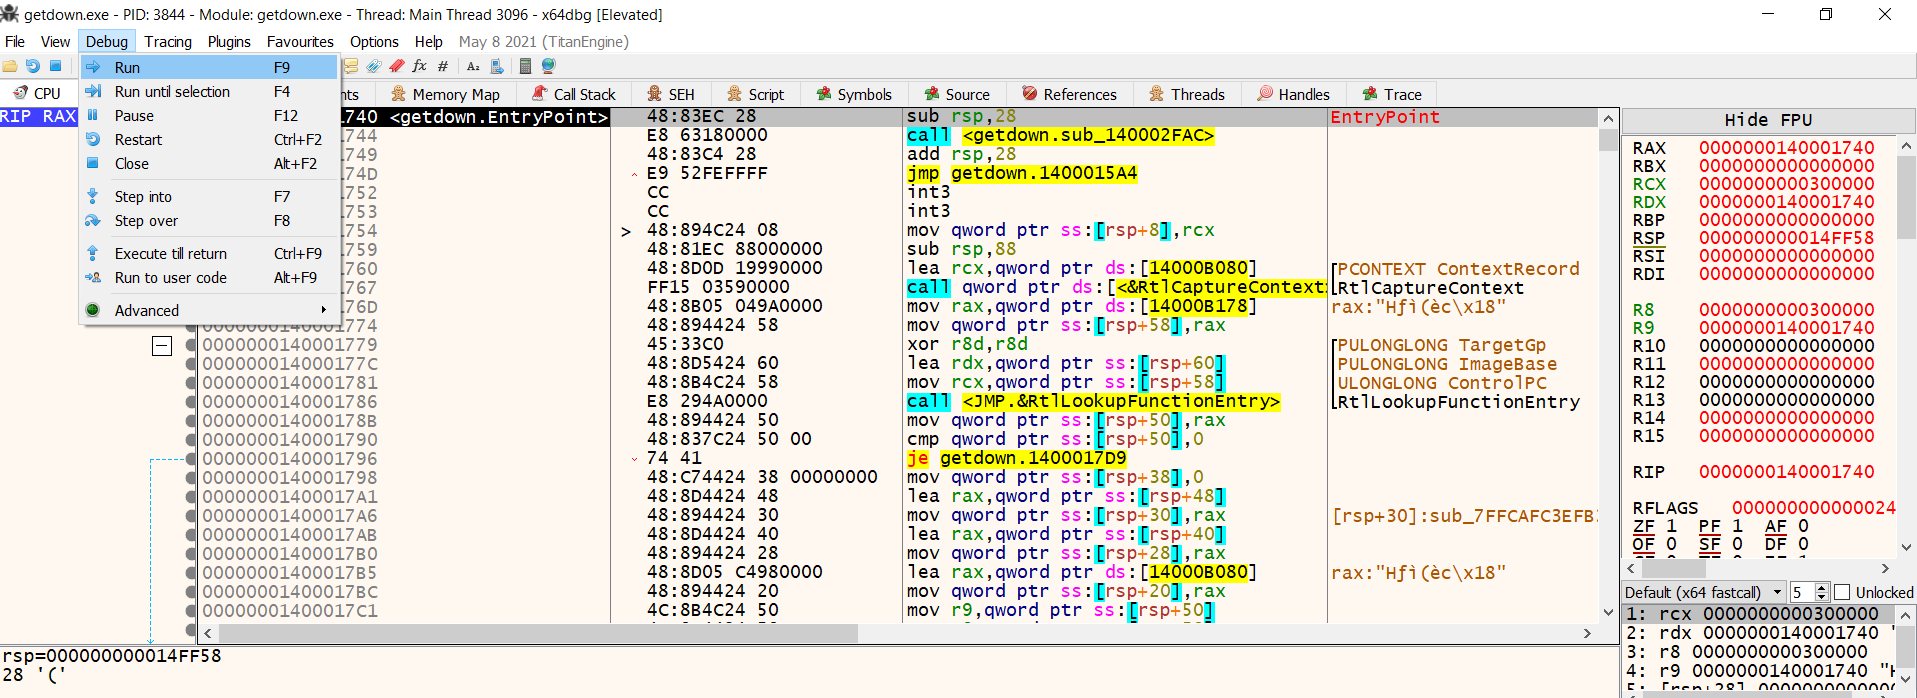
Lets load the Program Again inside x64dbg and try to fix this Problem!
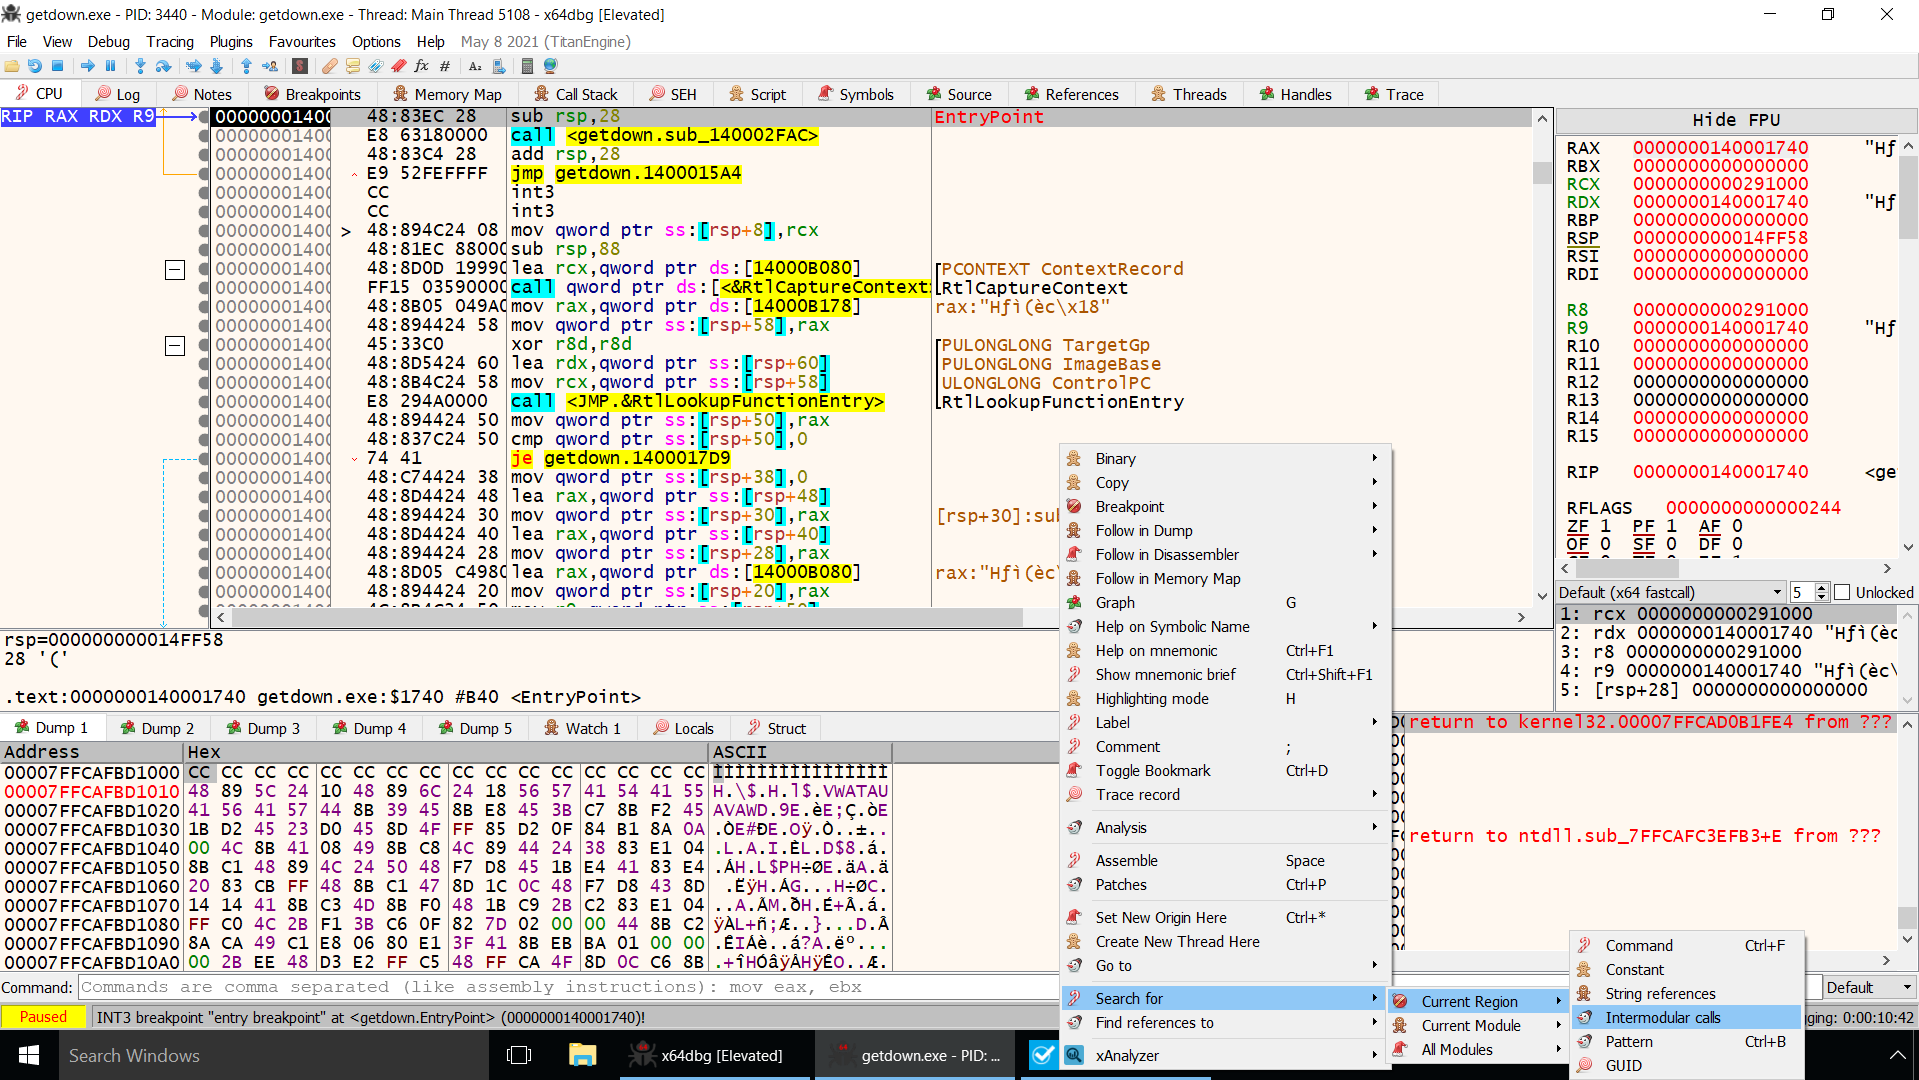
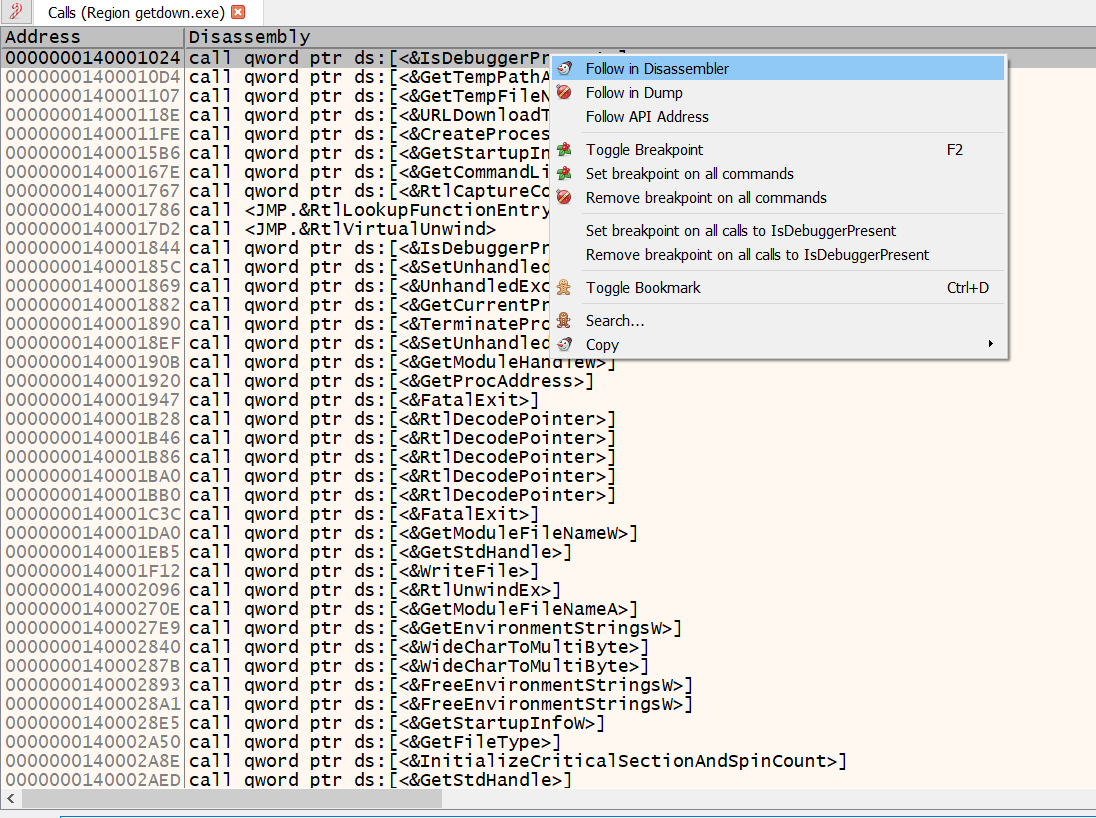
Right click on the CPU tab –> Search For –> Current Region –> Intermodular Calls
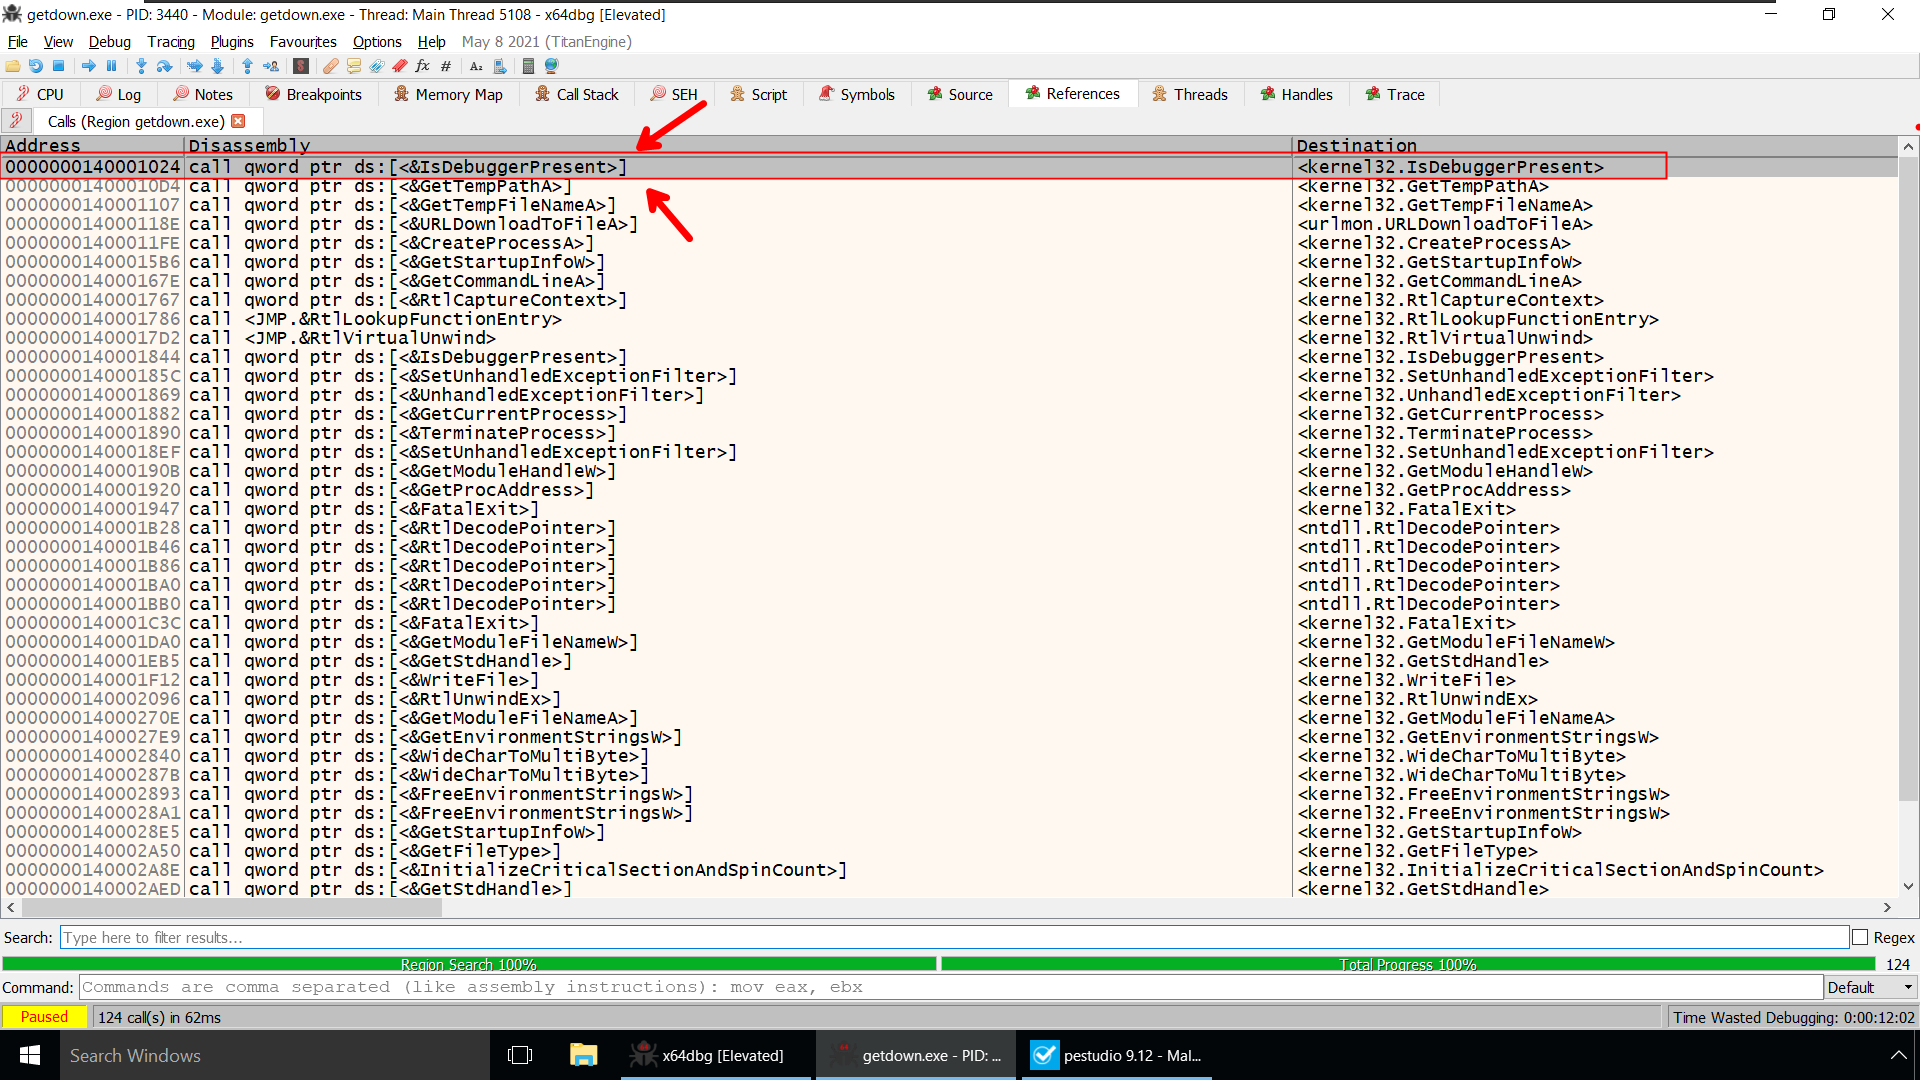
You Remember Right!!
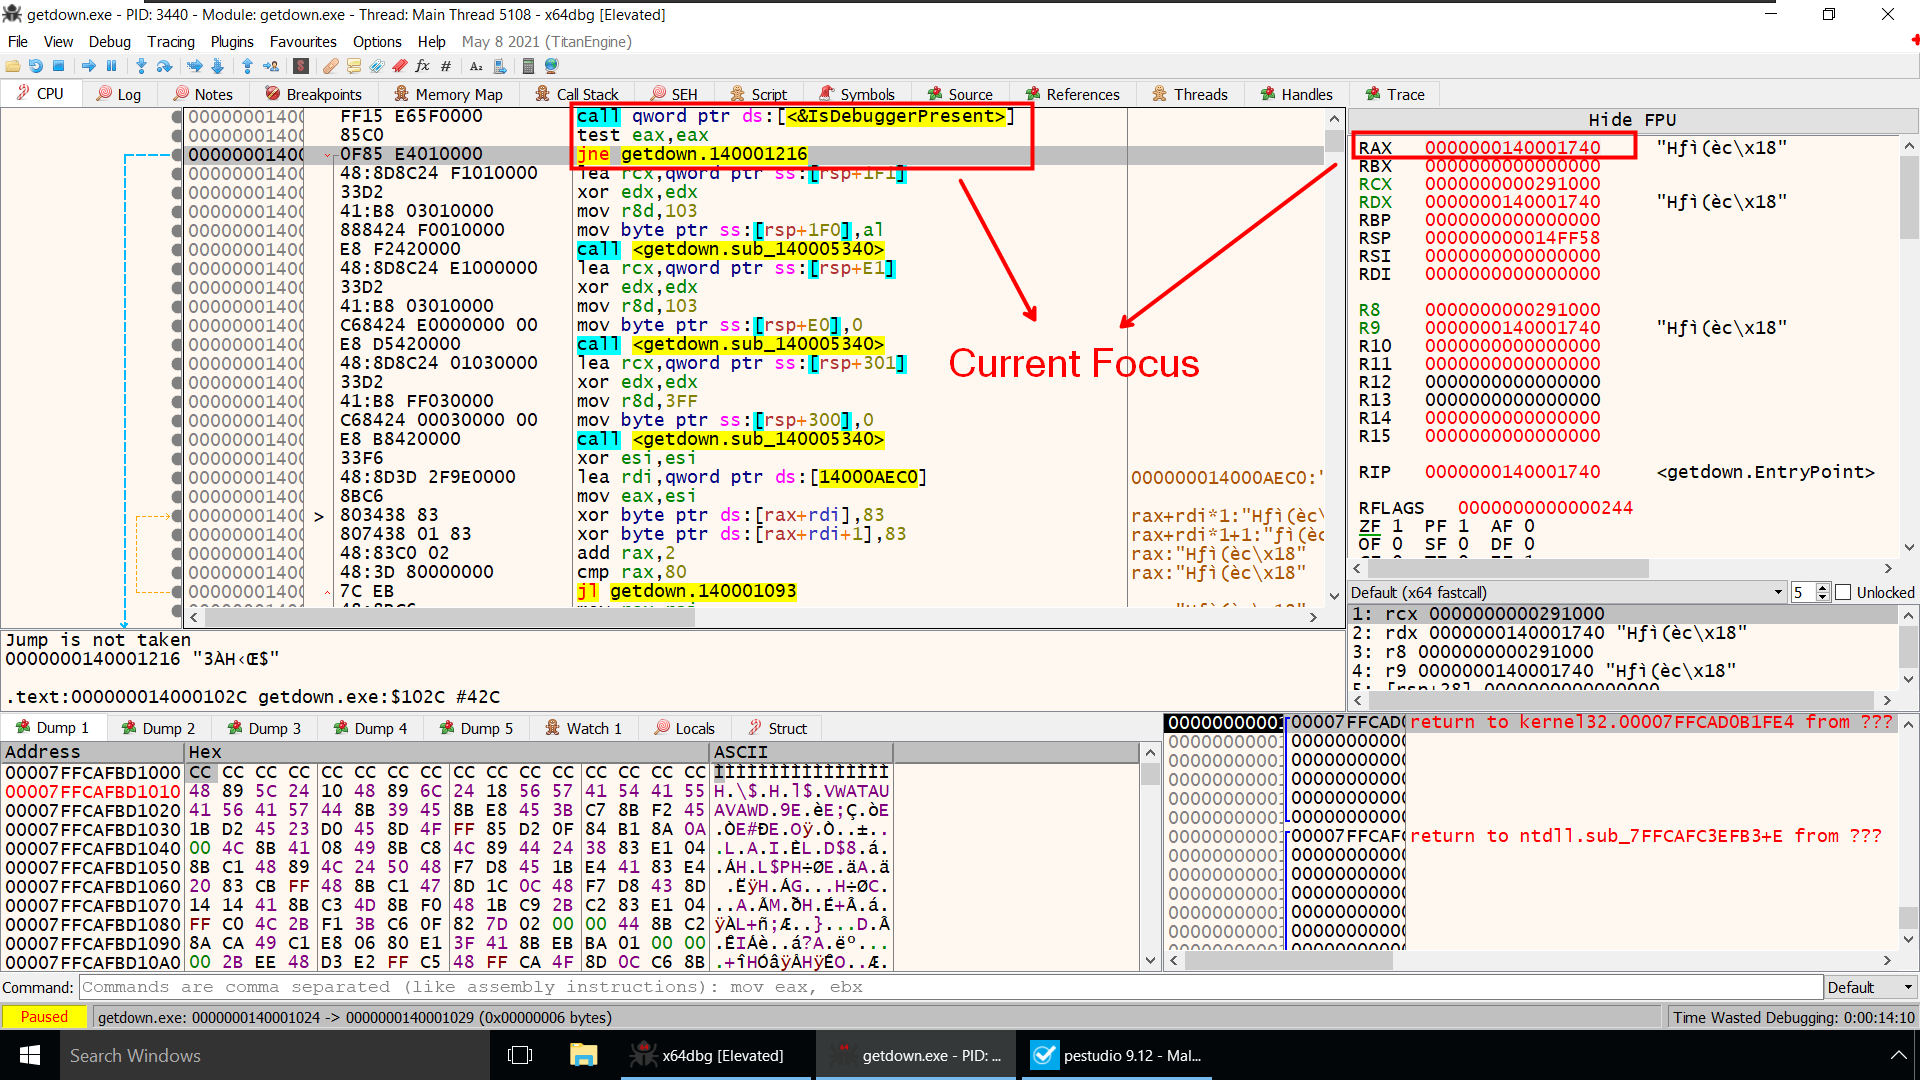
 As per the Documentation, Right after calling IsDebuggerPresent Function it will return a Non Zero value in Rax register if we are running the program inside a debugger.
Presently Rax contains some value(before IsdebuggerPresent is Called)
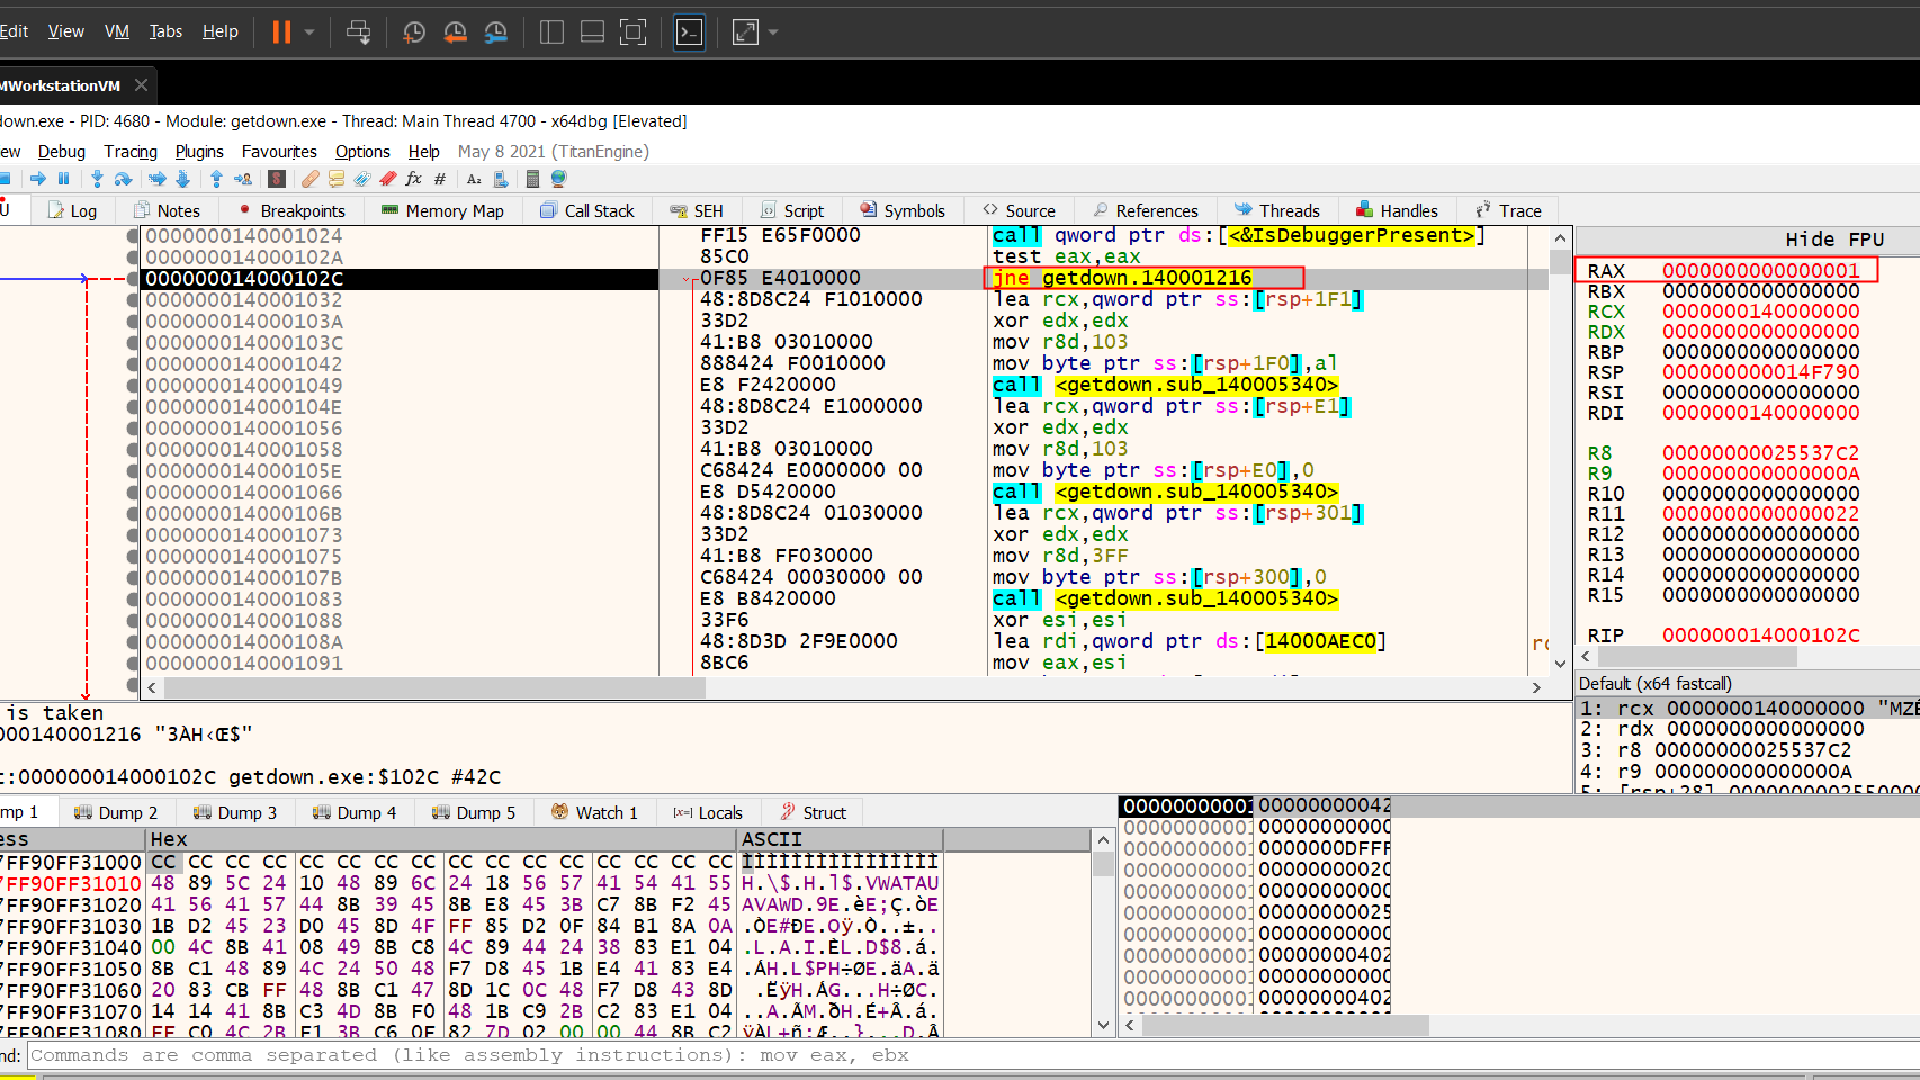
After IsDebuggerPresent is called it returns the value 1 which RAX now holds
Yes we can definetly change the value of RAX to 0 and it will be done! well nooo……. this approach is not that efficient (we need to change the value of RAX everytime IsDebuggerPresent is called).
So let’s actually Discuss a better of way defeating this anti-debugging technique .You are ready right!!!!!
We can also see the PEB inside x64dbg to do that press CTRL + G and write peb(), this will allow us to view the process environment block
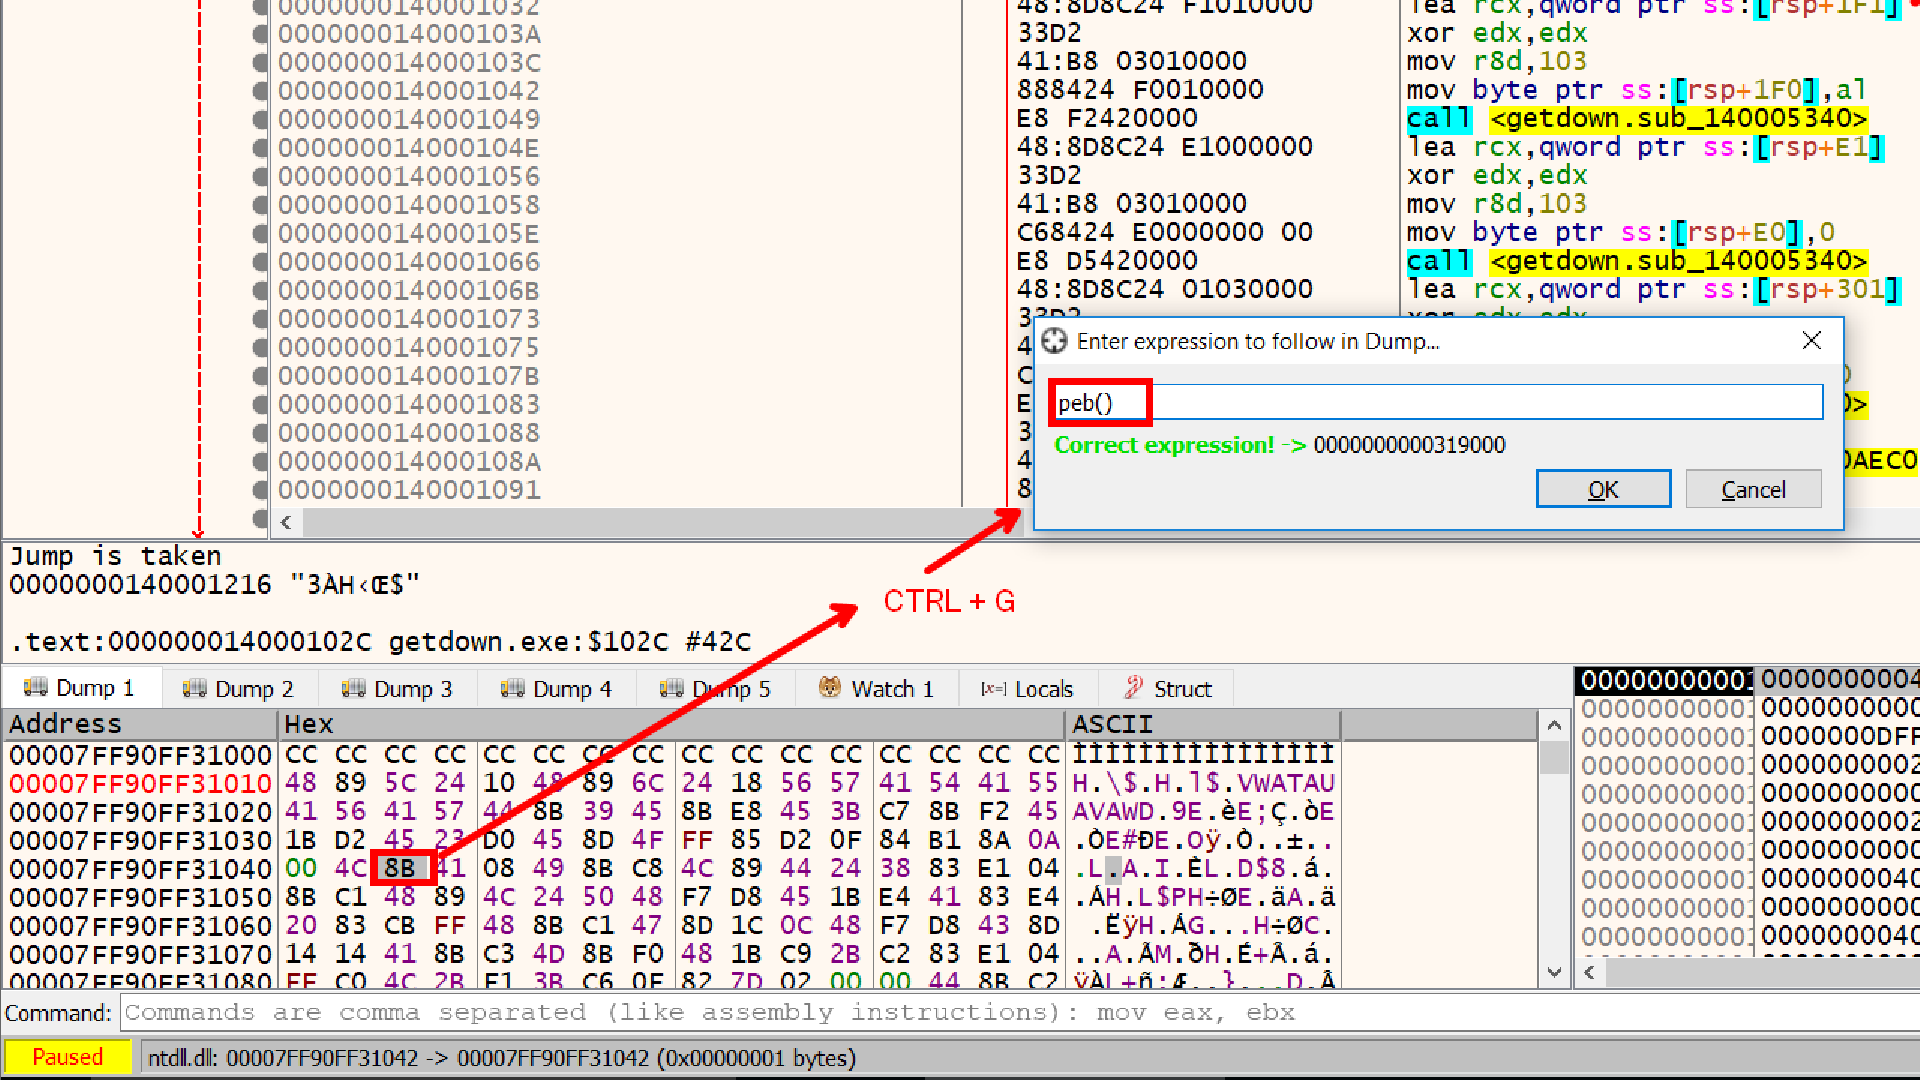
IsDebuggerPresent Reads that byte at offset 2
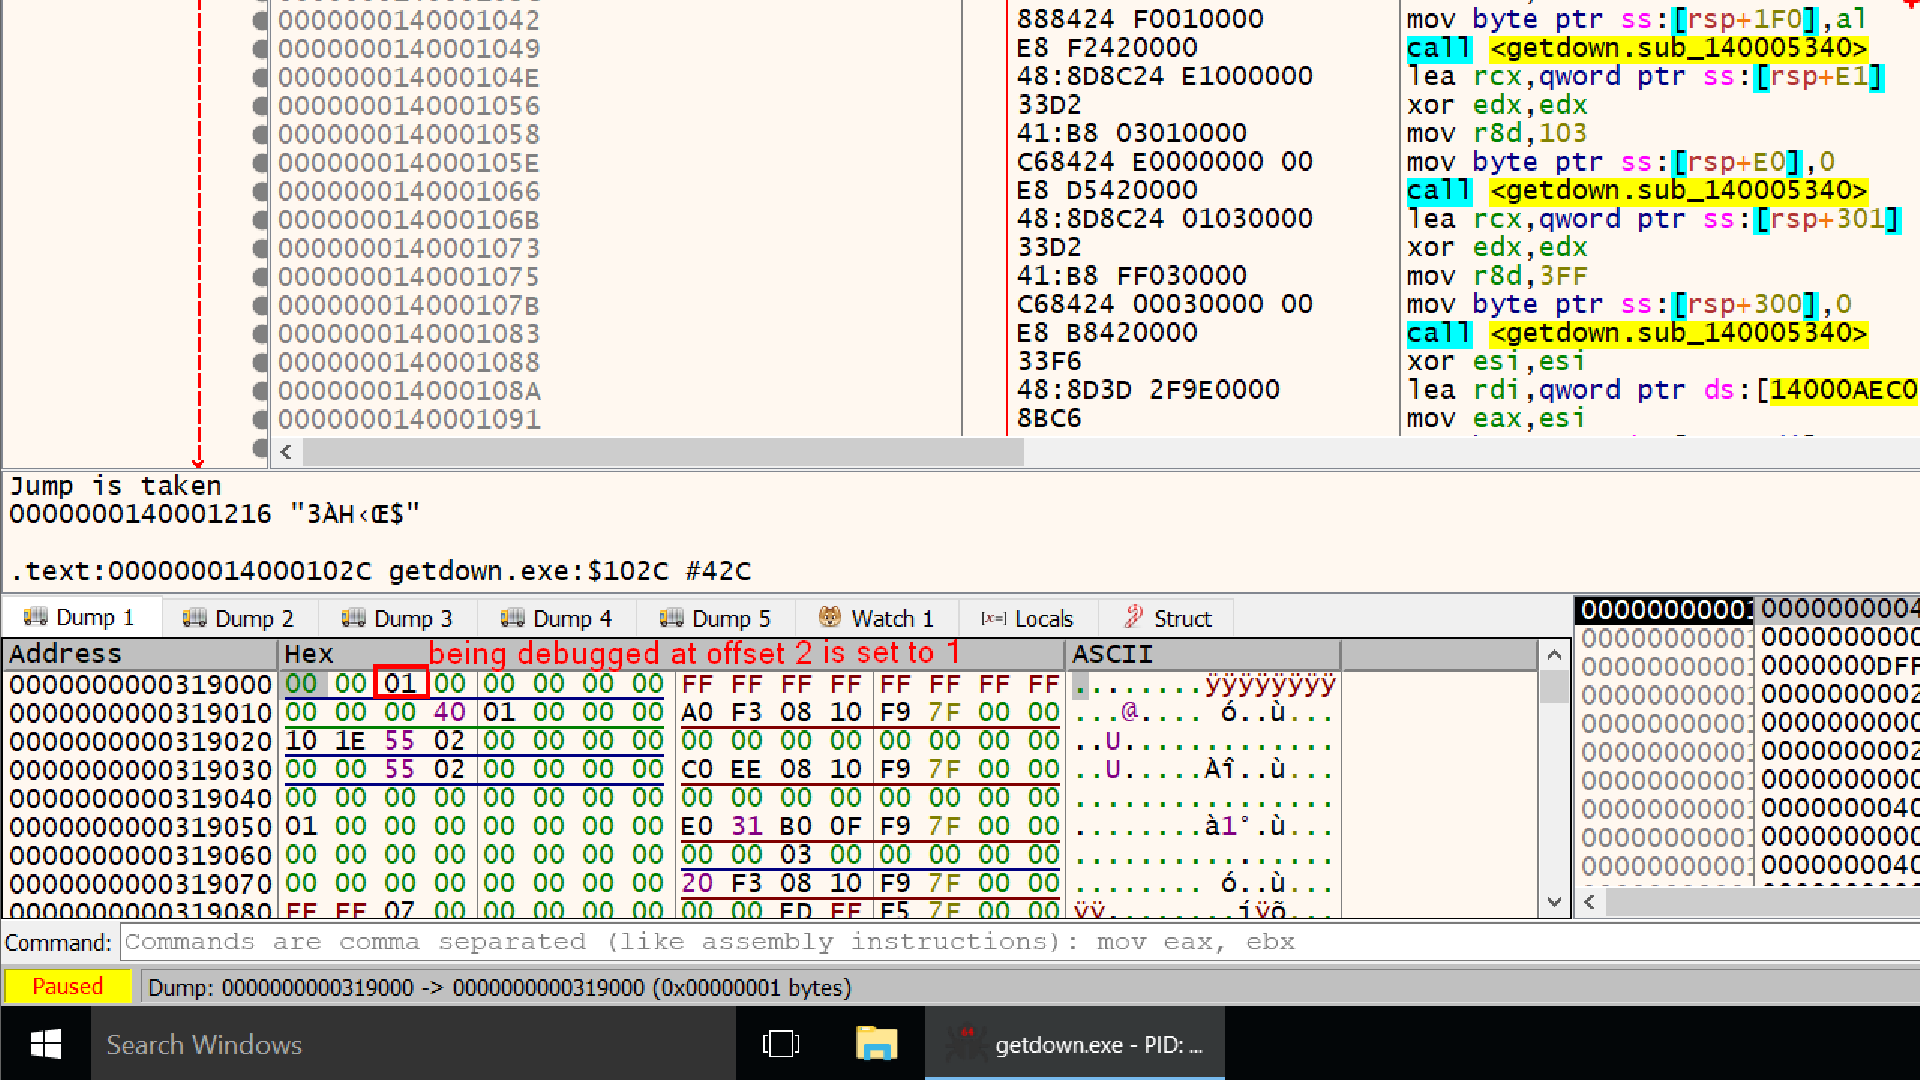
So another way to defeat this defense could be to overwrite that value from 1 to 0 at offset 2, this way whenever IsdebuggerPresent function will be called it will return 0.
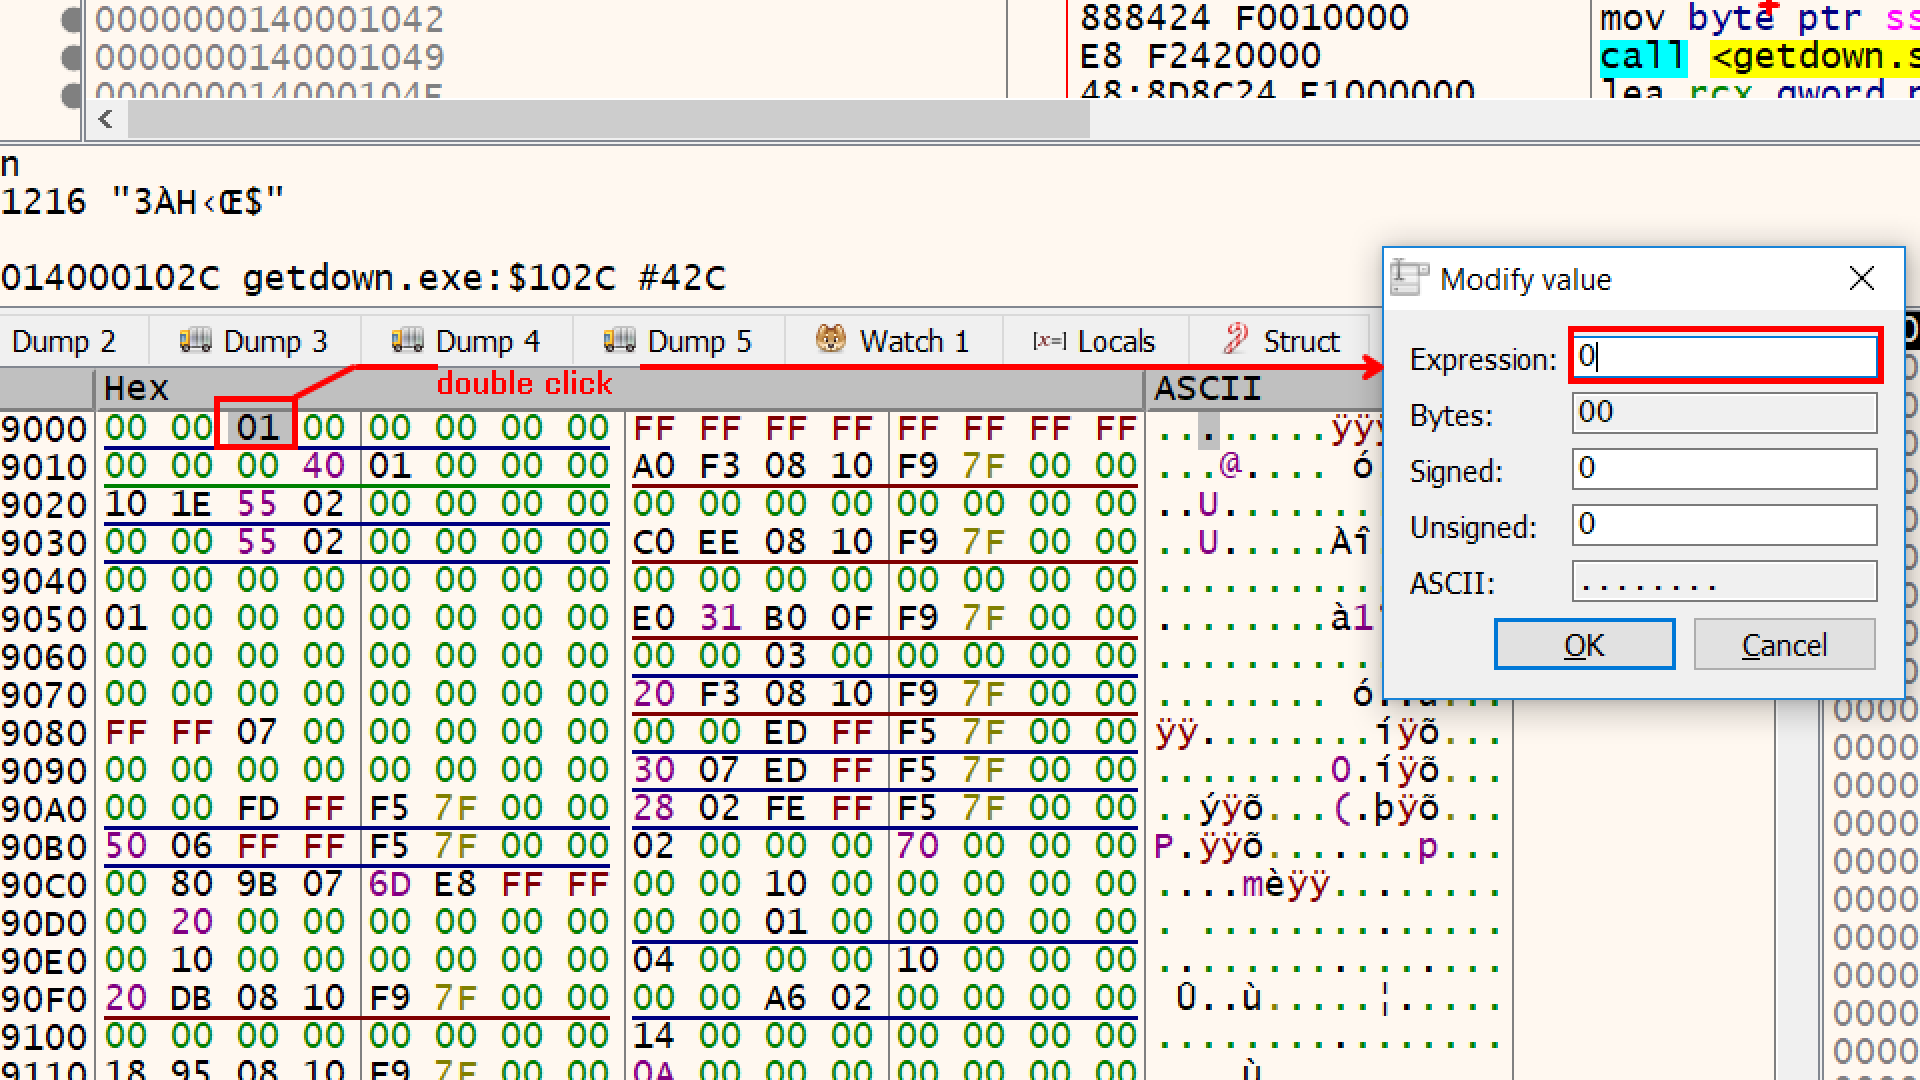
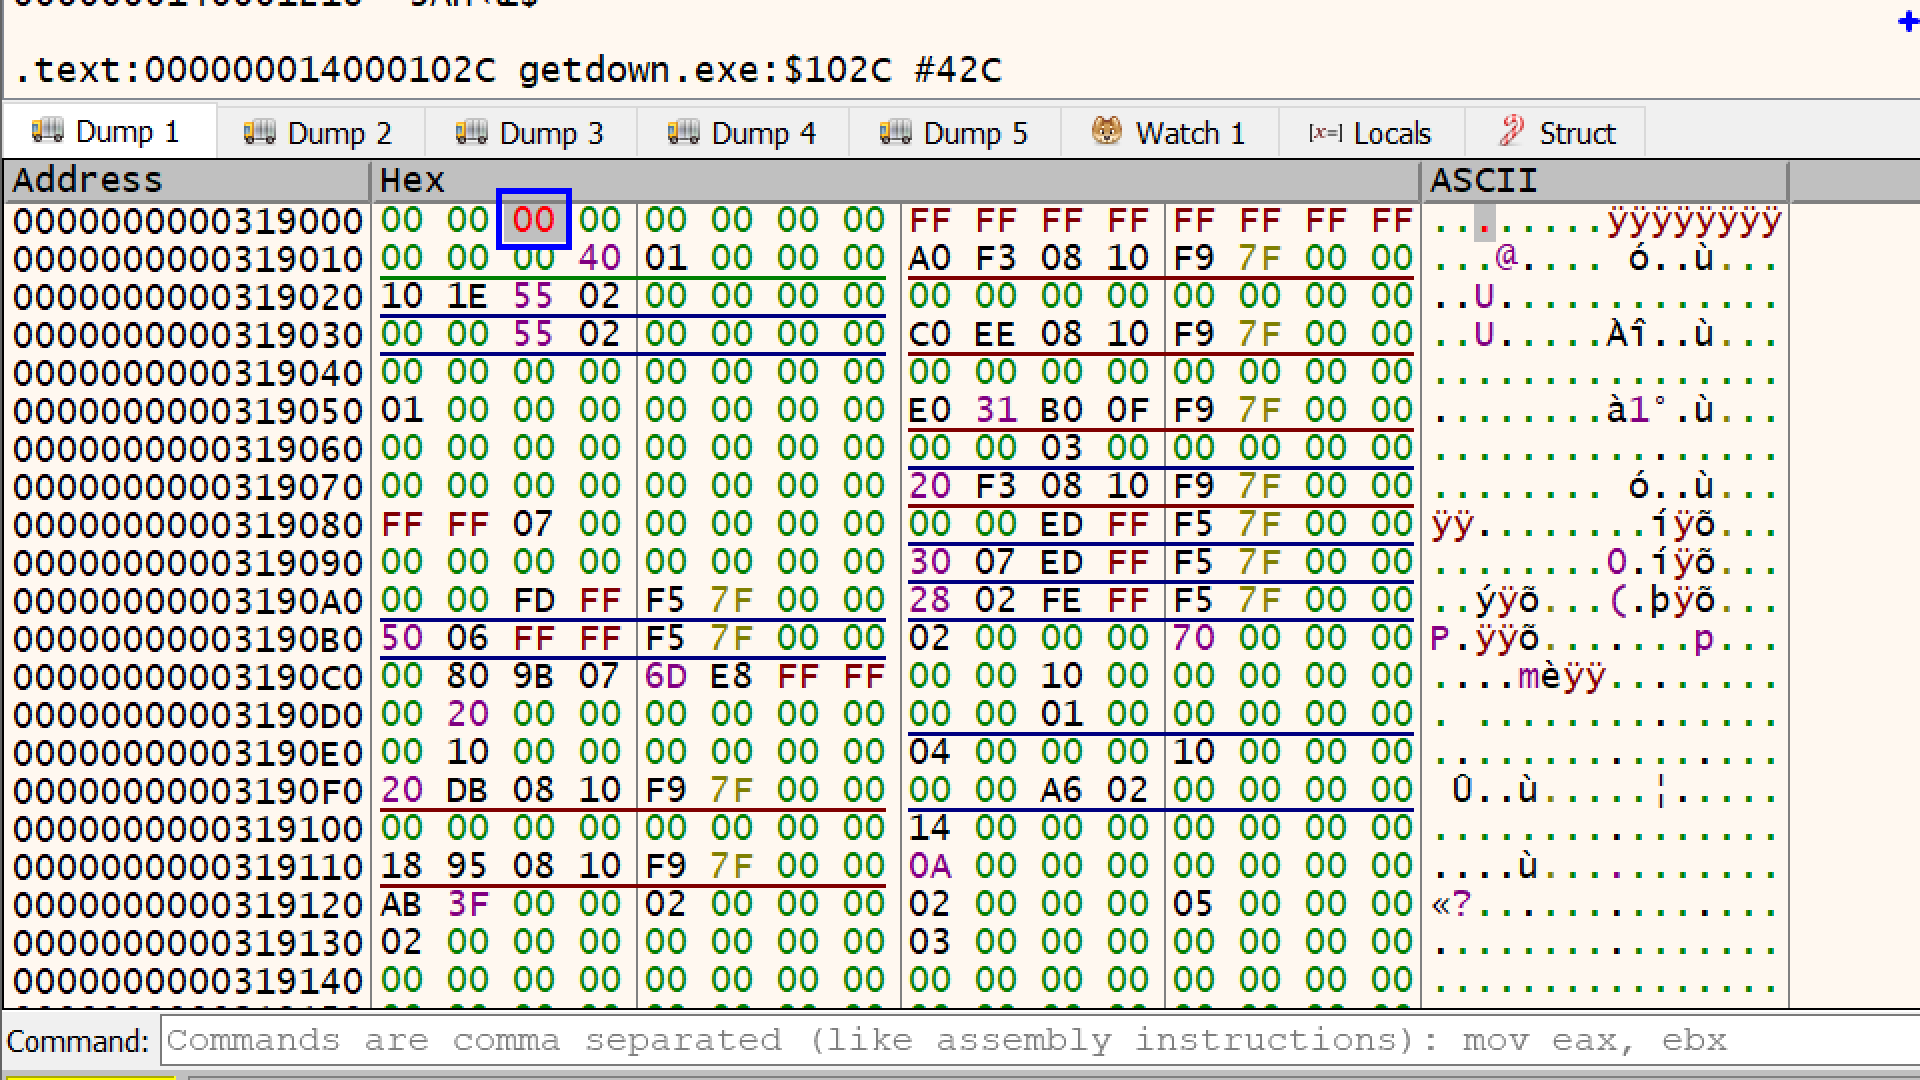
The debugger will immediately flag this modification by turning the text of that specific byte red. and we are good to go
Btw, Instead of you manually hunting down these bytes and changing it to 00 every time you restart the application, there is a pluging called ScyllaHide which intercepts the program’s checks and feeds it “fake” clean data.
Instead of calling IsDebuggerPresent, the specimen can manually check the BeingDebugged field in the PEB.
mov eax,fs:[30h]
mov eax,[eax+2]
test eax,eax
We will talk about the fs and gs segment registers in next blog. When we will learn about NtGlobalFlag stay tuned :)