Hey, hope you’re doing well :)
We’re back again with another anti-debugging technique commonly used by threat actors.
This time, we’ll be looking at how attackers detect debuggers by examining the value of NtGlobalFlag
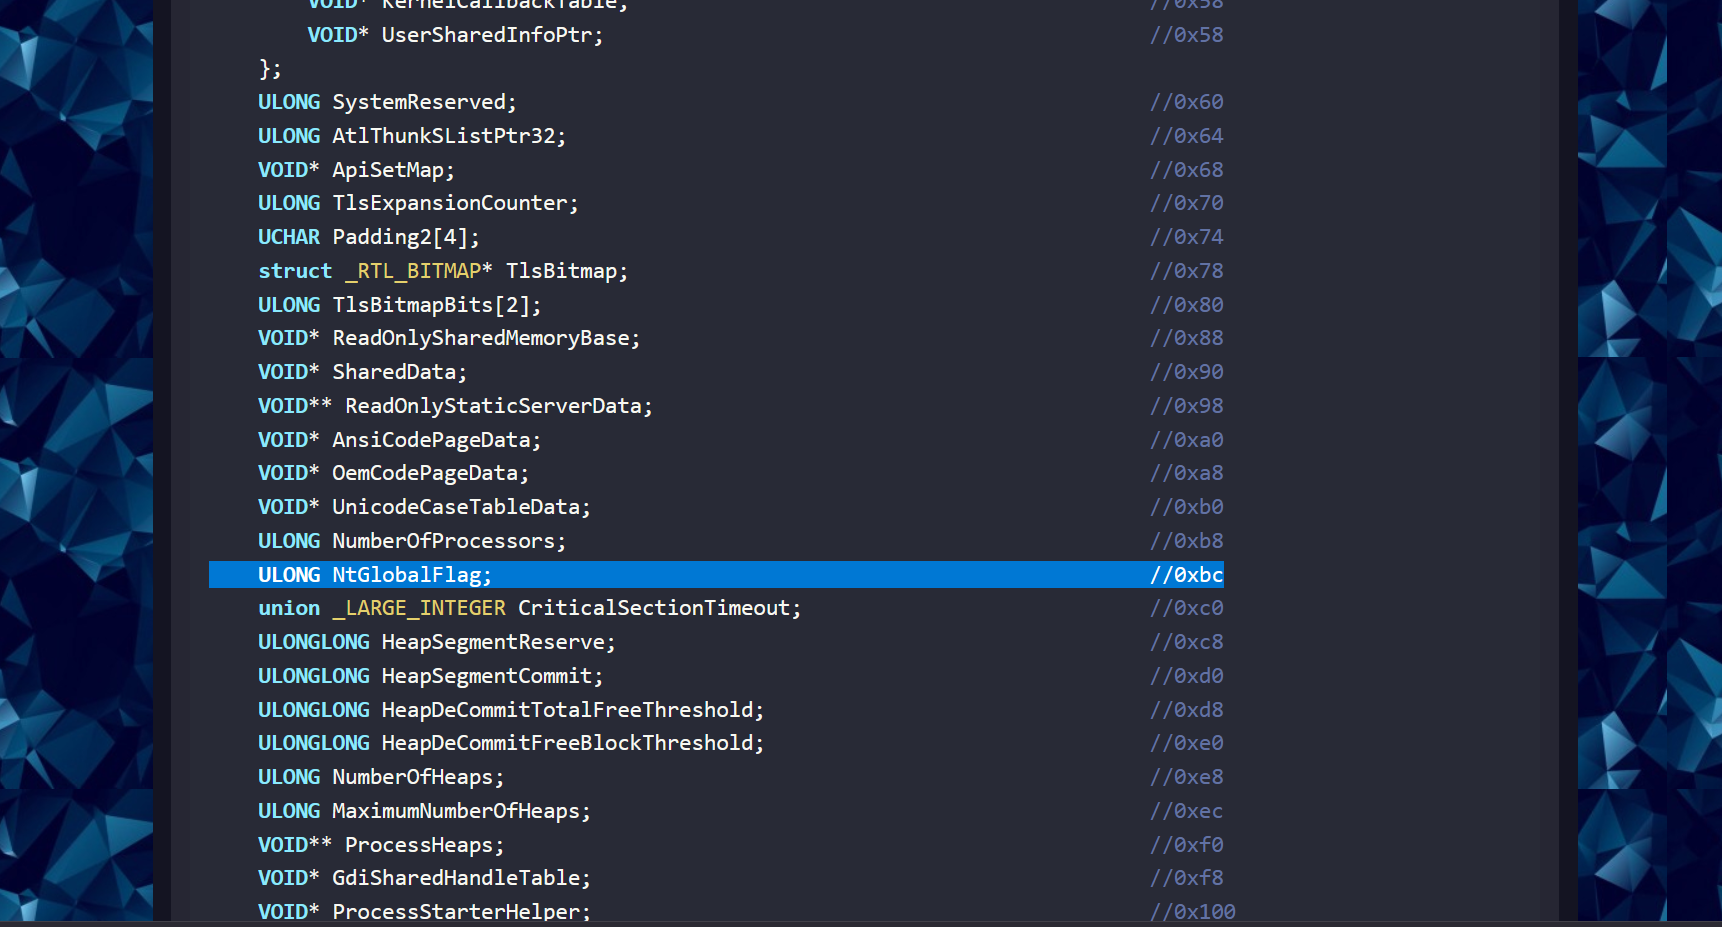
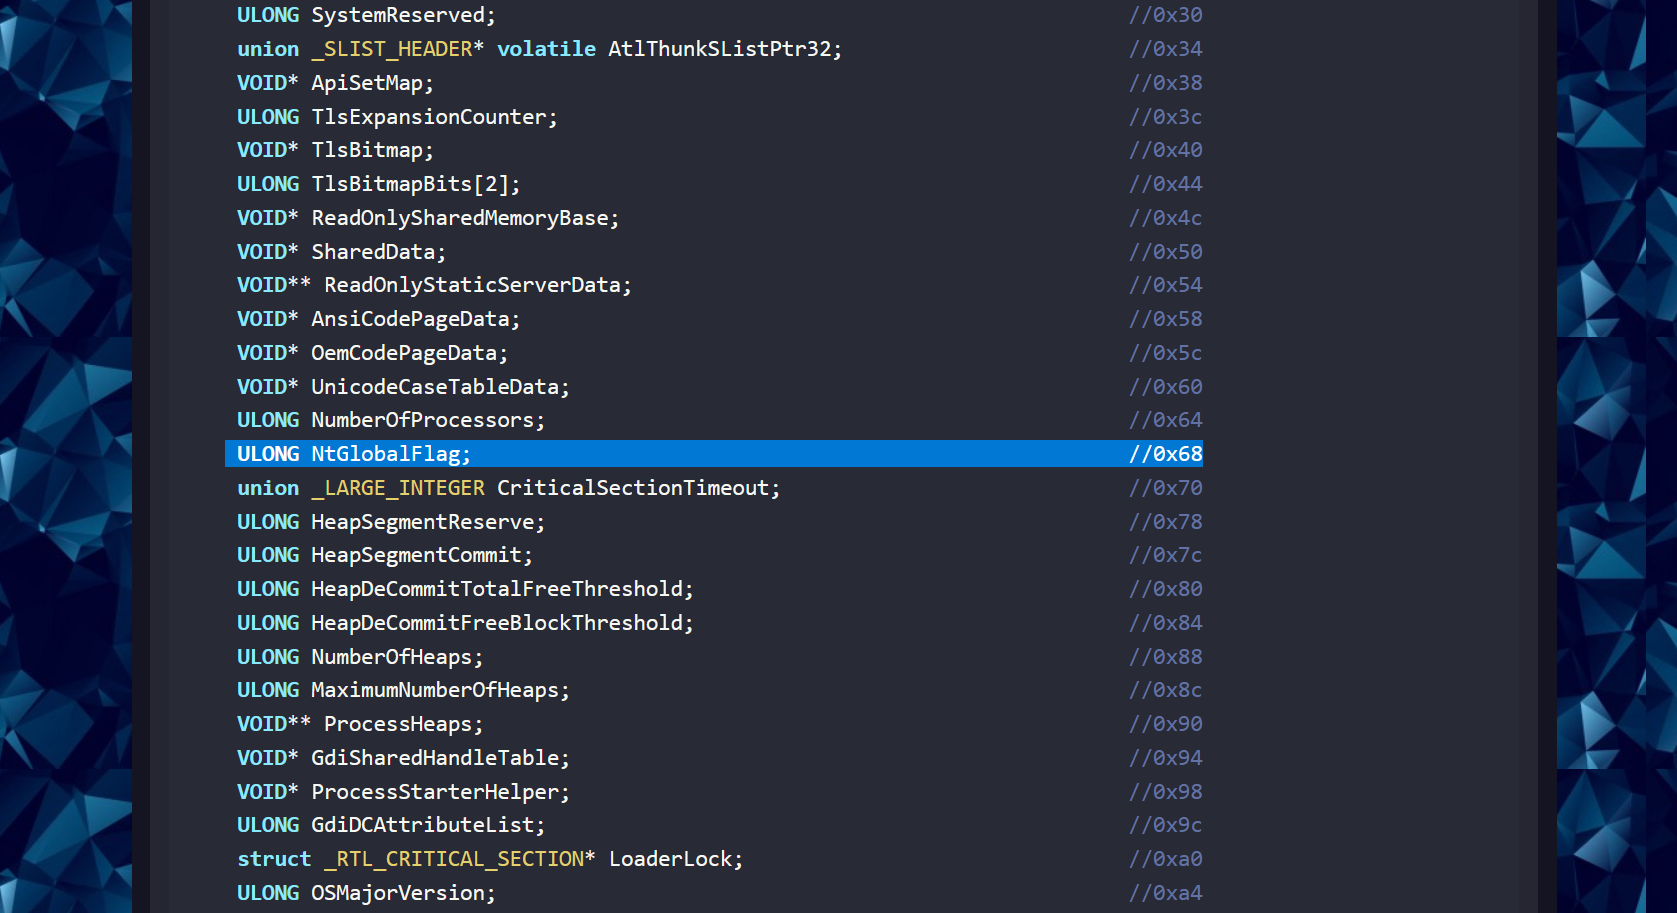
The NtGlobalFlag field exists at offset 0x68 in the Process Environment Block on the 32-bit versions of Windows, and at offset 0xBC on the 64-bit versions of Windows. The value in that field is zero by default.
For x86 we can see it is located at offset 0x68
When you double click an exe to run it, windows starts it normally. But if you launch it via a debugger (like x64dbg), windows automatically turns on special “Heap Debugging” features to help the programmer find memory leaks.
These features set specific bits in the NtGlobalFlag field inside the (PEB).
A process that is created by a debugger will have the following flags set:
+----------+------------------------------+------------------------------------------------------+
| Hex Value| Flag Name                    | What it does                                         |
+----------+------------------------------+------------------------------------------------------+
| 0x10     | FLG_HEAP_ENABLE_TAIL_CHECK   | Adds patterns after memory blocks to catch overflows.|
+----------+------------------------------+------------------------------------------------------+
| 0x20     | FLG_HEAP_ENABLE_FREE_CHECK   | Checks memory when it is freed.                      |
+----------+------------------------------+------------------------------------------------------+
| 0x40     | FLG_HEAP_VALIDATE_PARAMETERS | Ensures heap function arguments are valid.           |
+----------+------------------------------+------------------------------------------------------+
| = 0x70   | Total                        | " Yes I was created by a debugger :)"                       |
+----------+------------------------------+------------------------------------------------------+
Thus, a way to detect the presence of a debugger is to check for the combination of those flags.This value 0x70 can be checked by the programmer to detect if the their software is running inside a debugger.
By reading the value directly from memory instead of using usual suspects like
NtQueryInformationProcess orIsDebuggerPresent, malware can prevent noisy WINAPI calls. This makes it harder to spot this technique.
So, now we know that checking NtGlobalFlag detects a debugger, lets try to understand how this can be done!
The check can be made using this 32-bit code to examine the 32-bit Windows environment on both 32-bit and 64-bit versions of Windows, due to backward compatibility provided by WoW64.
mov eax, fs:[30h]   ; Process Environment Block (PEB)
mov al, [eax+68h]   ; load NtGlobalFlag (byte) from PEB + 0x68
and al, 70h         ; keep only bits 0x10,0x20,0x40
cmp al, 70h         ; compare to 0x70 (all three set?)
je being_debugged   ; jump if equal
Before we understand this assembly above lets first try to understand a little about segment registers
what are Segment registers?
On x86/x64 CPUs, segment registers were originally used to divide memory into segments.
The main ones are:
-
CS– Code -
DS– Data -
SS– Stack -
FS -
GS
Today, most segmentation is unused, except FS and GS. Windows uses FS and GS for thread-specific data.
The FS register points to a structure called a Thread Environment Block (TEB) or Thread Information Block (TIB). This structure stores information about the currently running thread.
This is mainly used because information can be obtained without calling API functions.
- Note that the
FS register points to the first address of theTEB, so you can add values by position to access the desired fields. - In the x64 environment, the
GS register is used instead of theFSregister.
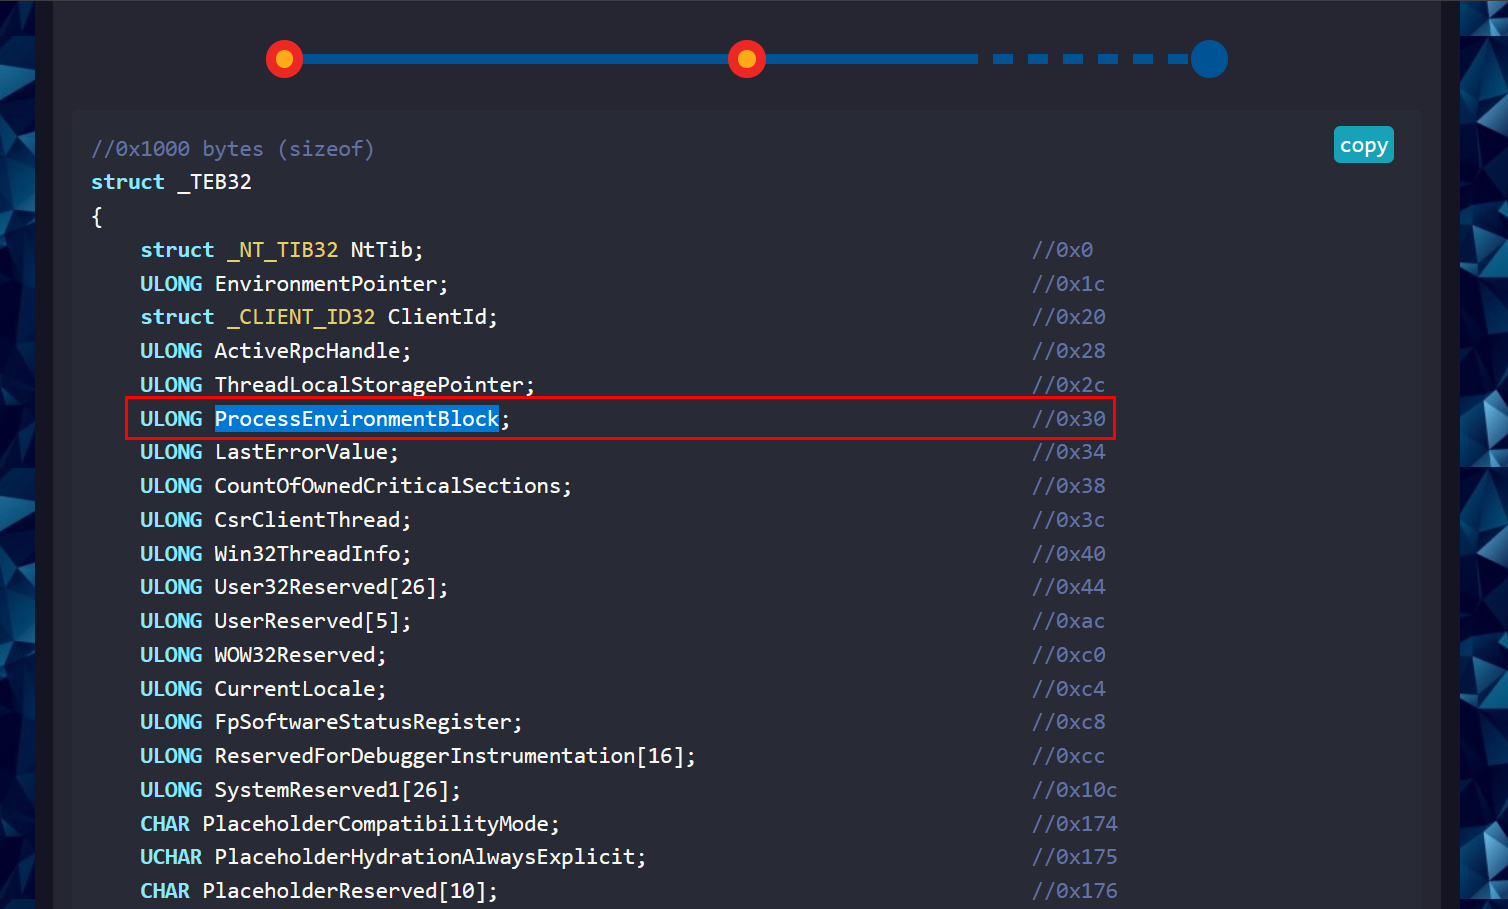
The PEB can be found at fs:[0x30] in the Thread Environment Block for x86 processes
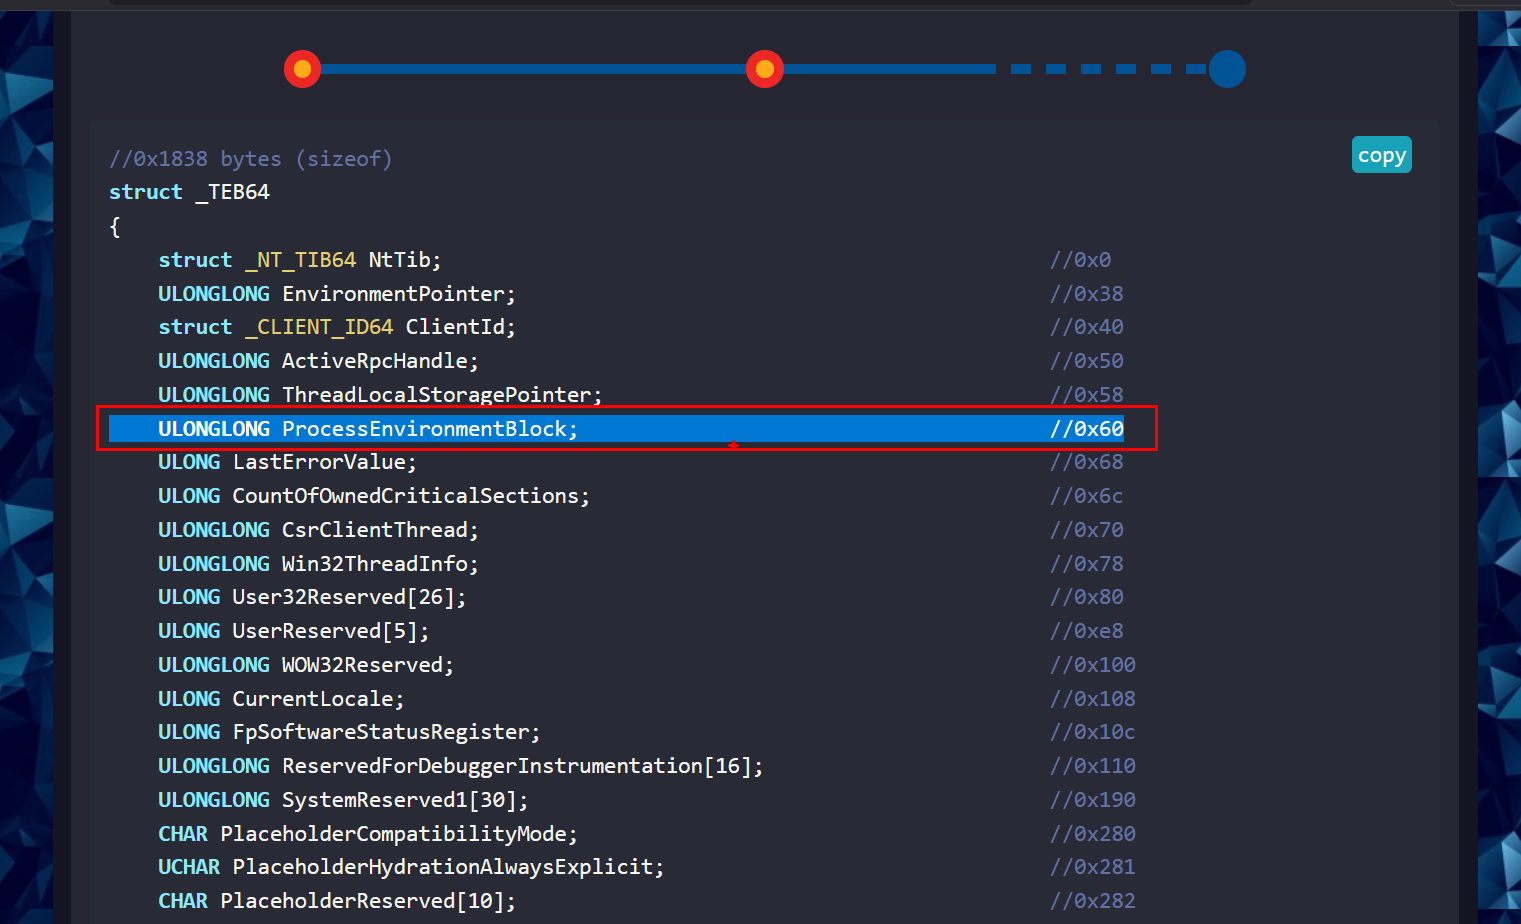
And at gs:[0x60] for x64 processes.
Let us try to understand the assembly snippet now
mov eax, fs:[30h]   ; Process Environment Block (PEB)
mov al, [eax+68h]   ; load NtGlobalFlag (byte) from PEB + 0x68
and al, 70h         ; keep only bits 0x10,0x20,0x40
cmp al, 70h         ; compare to 0x70 (all three set?)
je being_debugged   ; jump if equal
- Loads the address of the PEB into
EAX
mov eax, fs:[30h]


EAX = address of PEB
- We saw earlier that Offset
0x68 inside the 32-bit PEB Contains NtGlobalFlag
mov al, [eax+68h]
But why are we using al why not the entire Register?
+----------------------------------------------------------+
|                        RAX (64 bits)                     |
+-------------------------------+--------------------------+
|         Upper 32 bits         |        EAX (32 bits)     |
|                               +-------------+-------------+
|                               |   AX (16)   |            |
|                               +------+------+            |
|                               | AH 8 | AL 8 |            |
|                               +------+------+            |
+-------------------------------+--------------------------+
Because:
-
NtGlobalFlag is 1 byte -
AL is the lowest 8 bits of EAX
Therefore, The above instruction reads only 1 byte from memory and stores it in AL.
Now
AL = NtGlobalFlag
-
and al, 70h removes all bits except the three debugger-related heap flags so we can check only what we care about. Because NtGlobalFlag may contain many flags, not only debug related ones. We want only these three.
and al, 70h
Let’s understand this, we know that:
AL = NtGlobalFlag value
It is 1 byte (8 bits)
Example value
AL = 01110101b ; some flags set
we are comparing this value with 70h
70h = 0x70 = 01110000b


Convert hex into binary
so we are interested in only these bits
Bit positions:  7 6 5 4 3 2 1 0
70h mask:       0 1 1 1 0 0 0 0


6 5 4
These correspond to:
0x10 0x20 0x40
   AL     = 01110101
AND 70h   = 01110000
-------------------
RESULT    = 01110000
All bits outside 0x70 are cleared, Only bits 0x10, 0x20, 0x40 survive, and the reason why we did this? i mentioned it earlier :) Because NtGlobalFlag may contain many flags, not only debug related ones. We want only these three.
- Comparing the value inside AL with 70h
cmp al, 70h
After cmp, the CPU sets status flags in the EFLAGS register,
ZF (Zero Flag) – result was zero → values are equal.
-
JE checks ZF
je being_debugged

or


if (ZF == 1)
    jump to being_debugged
Let’s look at this inside Debugger
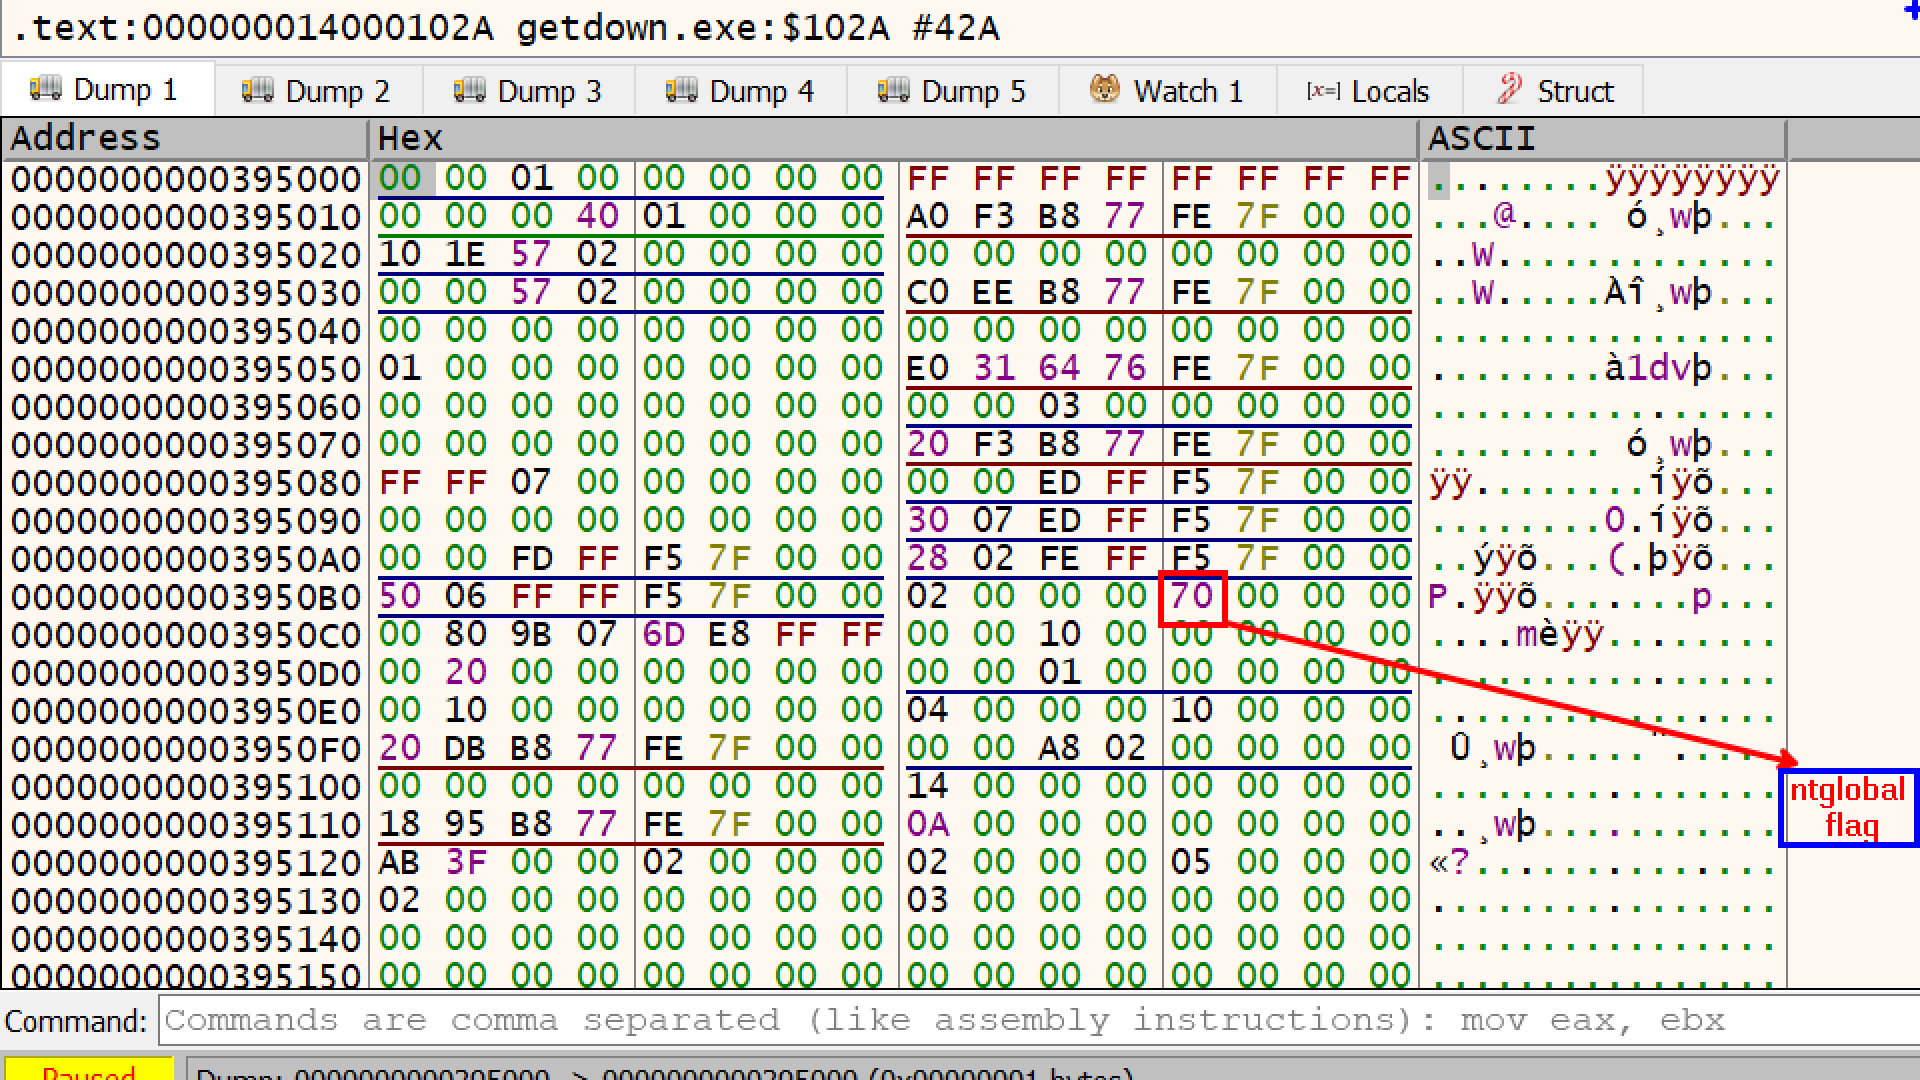
the ntglobalflag is set to 70 (indicating that the program is running inside a debugger).
Another way can be
mov eax,dword ptr fs:[30]
test byte ptr ds:[eax+68],70
In this example, the specimen places the address of the PEB into the EAX register. It then looks 0x68 bytes into the PEB (“eax+68”) to compare the contents of NtGlobalFlag to 0x70. Malware can perform the comparison using the instruction TEST. It could also use the AND instruction in a similar way.
Alright, then see you in the next one!, bye take care.