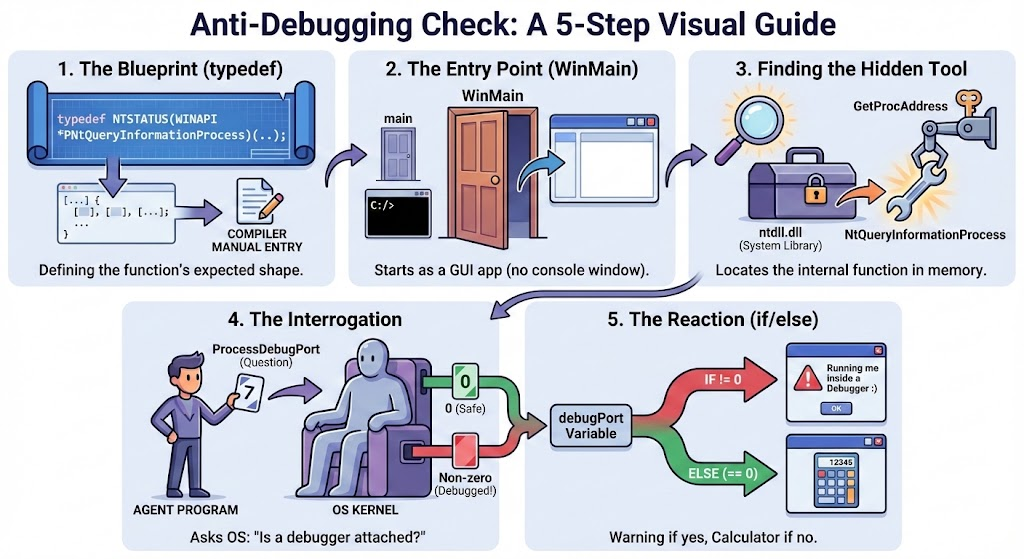
This API call is among those that malware can use to spot the presence of a debugger
- Tell the compiler exactly what the hidden function looks like
typedef NTSTATUS(WINAPI *PNtQueryInformationProcess)(
    HANDLE ProcessHandle,
    DWORD ProcessInformationClass,
    PVOID ProcessInformation,
    DWORD ProcessInformationLength,
    PDWORD ReturnLength
);
The function NtQueryInformationProcess is an internal Windows function. It is not listed in the standard instruction manuals (header files) that come with your compiler. If you tried to use it directly, the compiler would scream, “I don’t know what this is!”
So, This block is us writing a manual entry for the compiler, saying: “Hey, there is a function that takes these specific 5 parameters and returns a status code.”
- The Entry Point (
WinMain)
int WINAPI WinMain(HINSTANCE hInstance, HINSTANCE hPrevInstance, LPSTR lpCmdLine, int nCmdShow) {
- Finding the Hidden Function (NtQueryInformationSystem)
HMODULE hNtdll = GetModuleHandleA("ntdll.dll");
PNtQueryInformationProcess pNtQueryInformationProcess =
    (PNtQueryInformationProcess)GetProcAddress(hNtdll, "NtQueryInformationProcess");
-
GetModuleHandleA("ntdll.dll"): This grabs a handle to the system library filentdll.dll. Think ofntdll.dllas a locked toolbox that Windows uses internally. -
GetProcAddress(...): This looks inside that toolbox for the specific tool named"NtQueryInformationProcess".
- The Interrogation (The Anti-Debug Check)
const int ProcessDebugPort = 7;
DWORD_PTR debugPort = 0;

NTSTATUS status = pNtQueryInformationProcess(
    GetCurrentProcess(),
    ProcessDebugPort,
    &debugPort,
    sizeof(debugPort),
    NULL
);
This is the core logic. We are calling the function we just found.
-
GetCurrentProcess(): We are asking about ourselves. -
ProcessDebugPort (Value 7) : This is the specific question we are asking the Operating System. The number 7 is code for: “Is there a communication port open for a debugger right now?” -
&debugPort: We give the function a blank piece of paper (a variable) to write the answer on.
When the function finishes, it writes a number into our debugPort variable.
- If it writes 0: No debugger is connected.
- If it writes -1 (or any non-zero number) : A debugger is attached.
- The Reaction
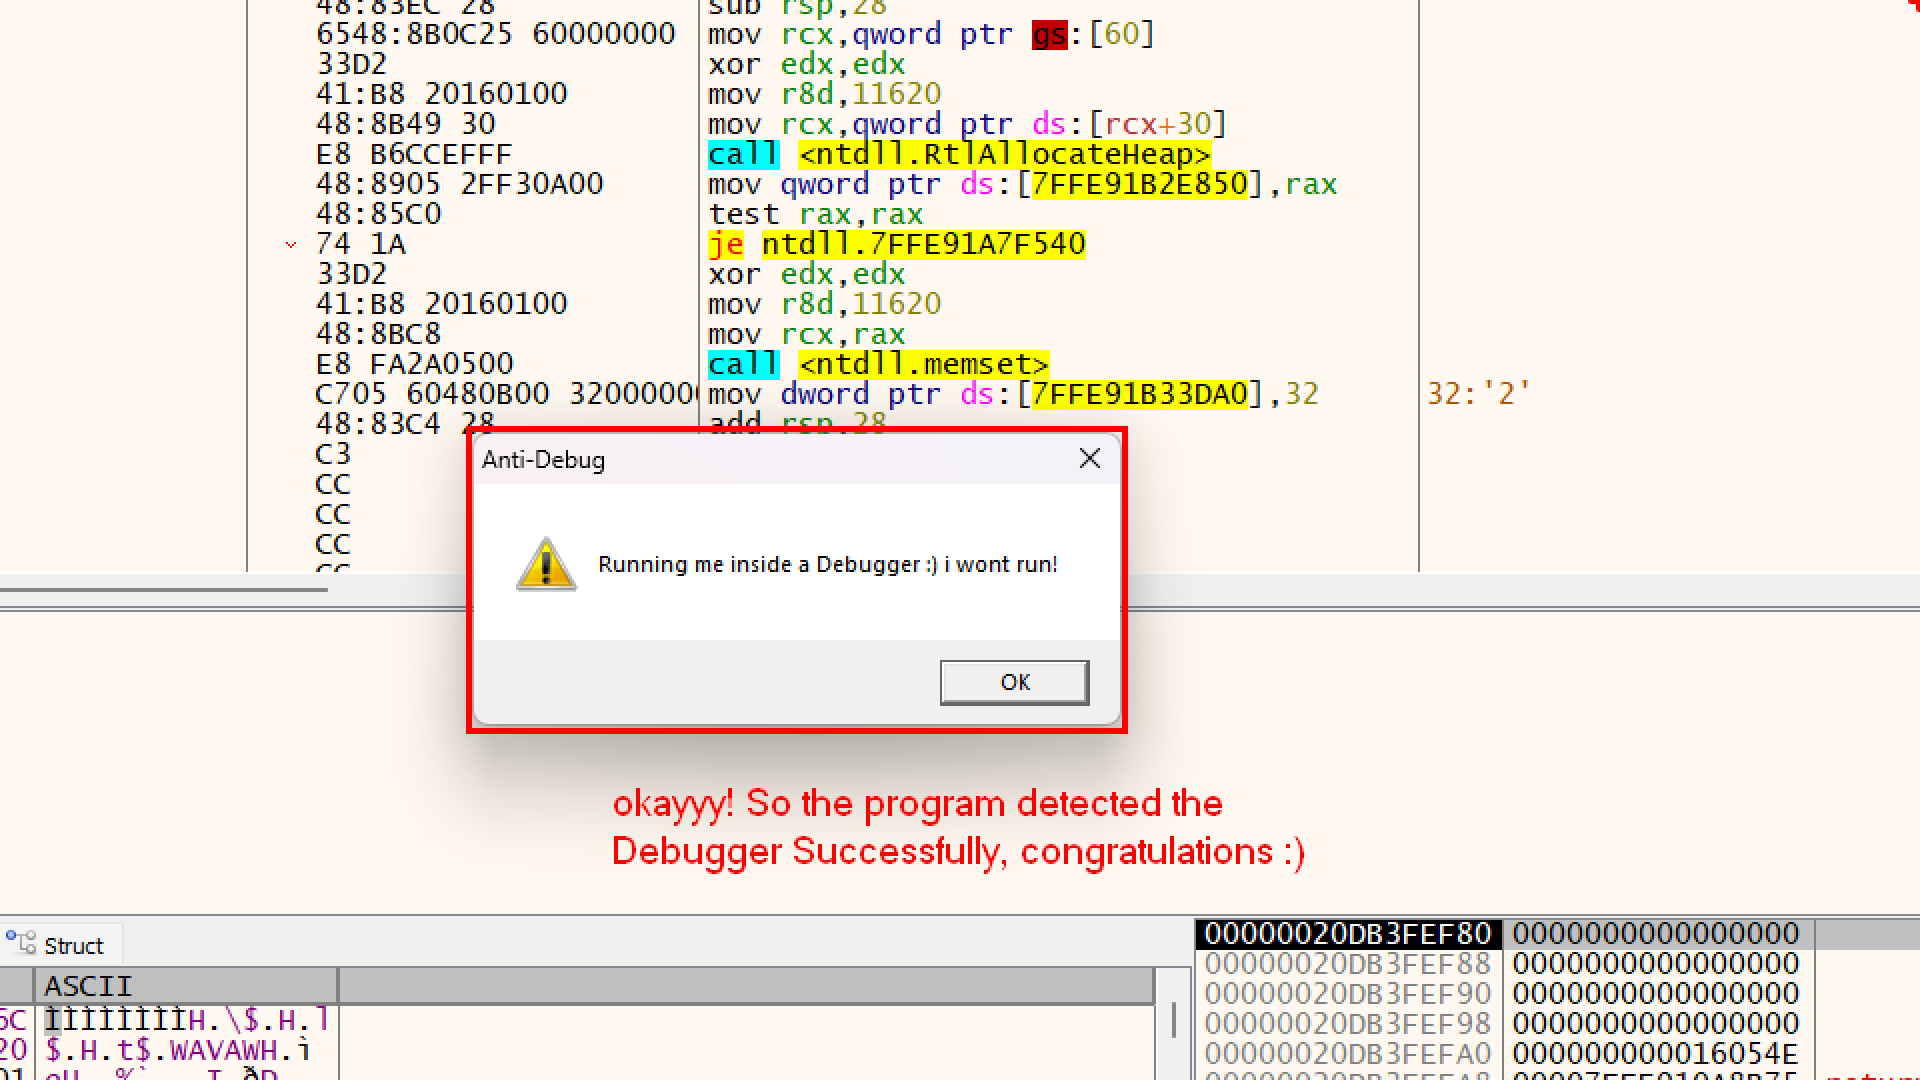
if (debugPort != 0) {
    MessageBoxA(NULL, "Running me inside a Debugger :) i wont run!", ...);
}
else {
    ShellExecuteA(NULL, "open", "calc.exe", NULL, NULL, SW_SHOW);
}
Bringing it all together
#include <windows.h>
typedef NTSTATUS(WINAPI *PNtQueryInformationProcess)(
HANDLE ProcessHandle,
DWORD ProcessInformationClass,
PVOID ProcessInformation,
DWORD ProcessInformationLength,
PDWORD ReturnLength
);
// WinMain()
int WINAPI WinMain(HINSTANCE hInstance, HINSTANCE hPrevInstance, LPSTR lpCmdLine, int nCmdShow) {
HMODULE hNtdll = GetModuleHandleA("ntdll.dll");
if (hNtdll == NULL) return 1;
PNtQueryInformationProcess pNtQueryInformationProcess =
(PNtQueryInformationProcess)GetProcAddress(hNtdll, "NtQueryInformationProcess");
if (pNtQueryInformationProcess == NULL) return 1;
const int ProcessDebugPort = 7;
DWORD_PTR debugPort = 0;
NTSTATUS status = pNtQueryInformationProcess(
GetCurrentProcess(),
ProcessDebugPort,
&debugPort,
sizeof(debugPort),
NULL
);
if (debugPort != 0) {
MessageBoxA(NULL, "Running me inside a Debugger :) i wont run!", "Anti-Debug", MB_ICONWARNING | MB_OK);
}
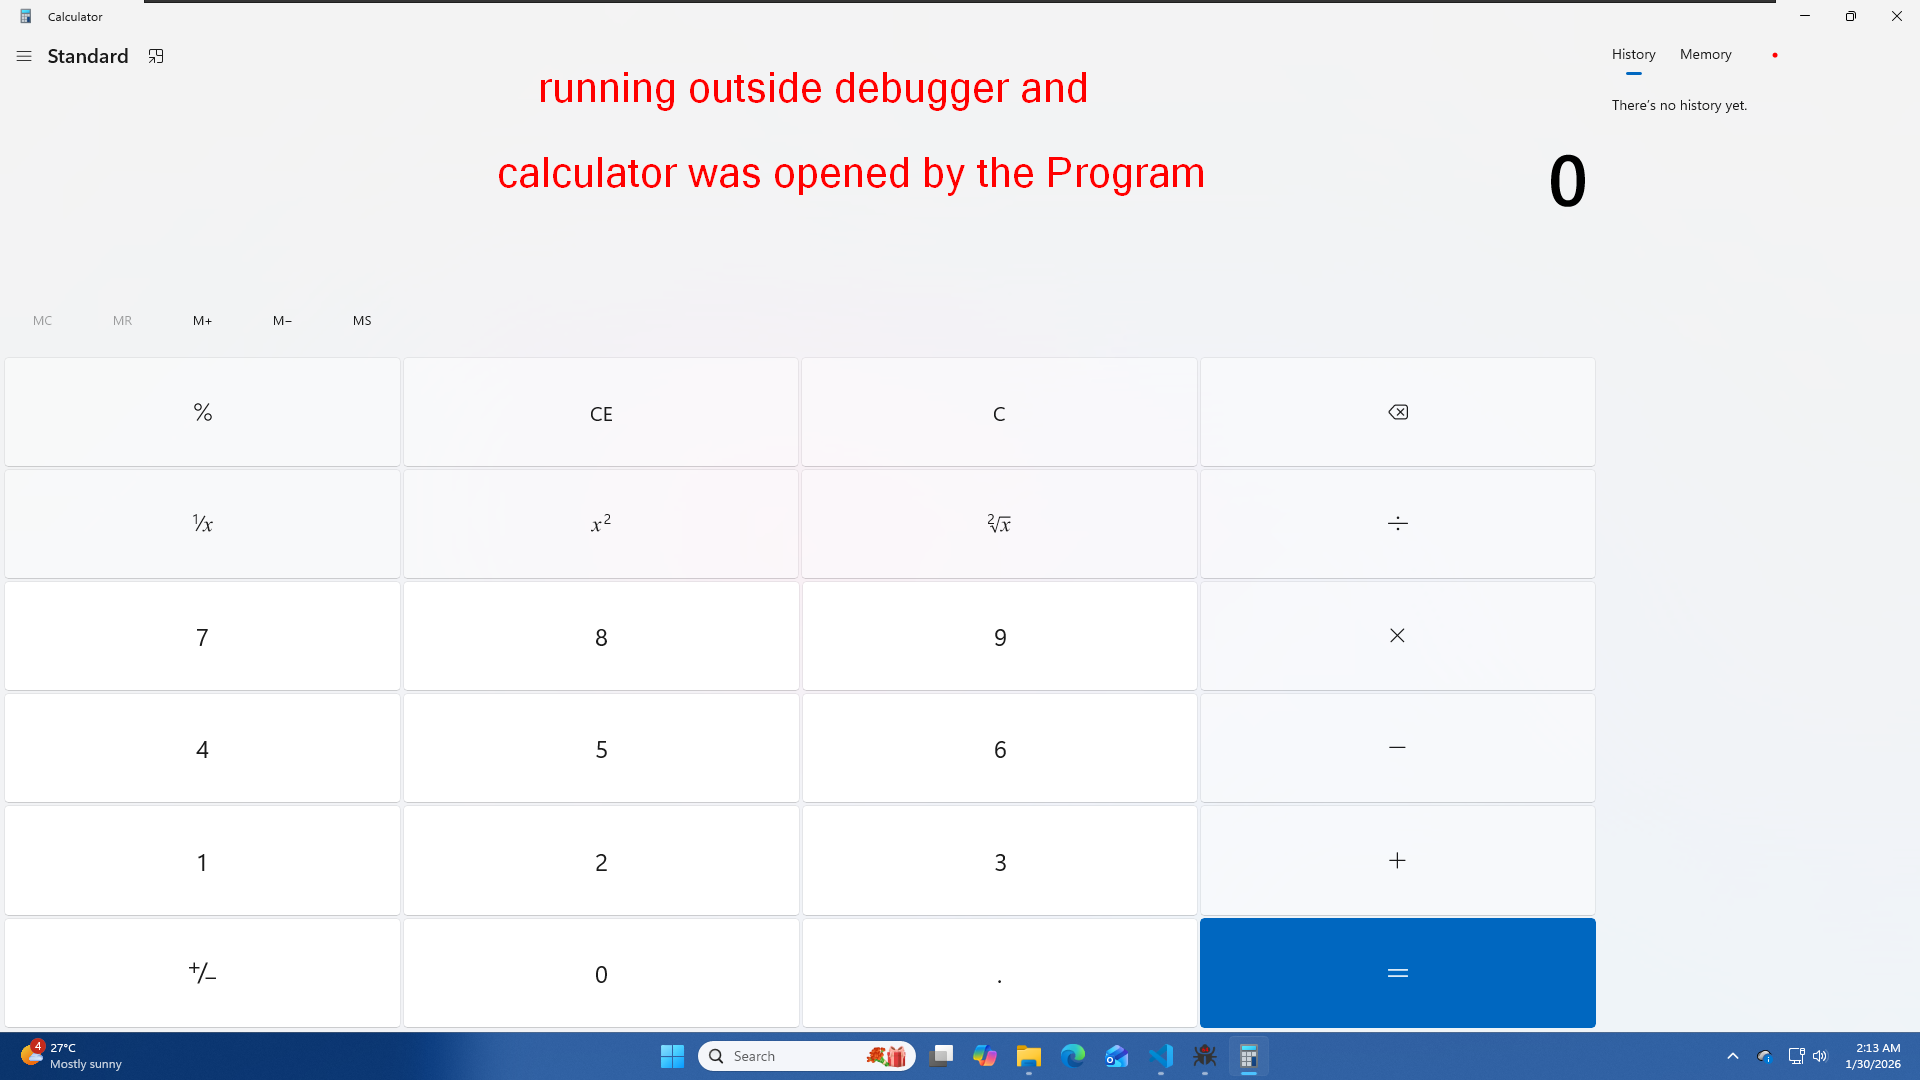
else {
ShellExecuteA(NULL, "open", "calc.exe", NULL, NULL, SW_SHOW);
}
return 0;
}
Compile the Program
g++ program.exe -o program
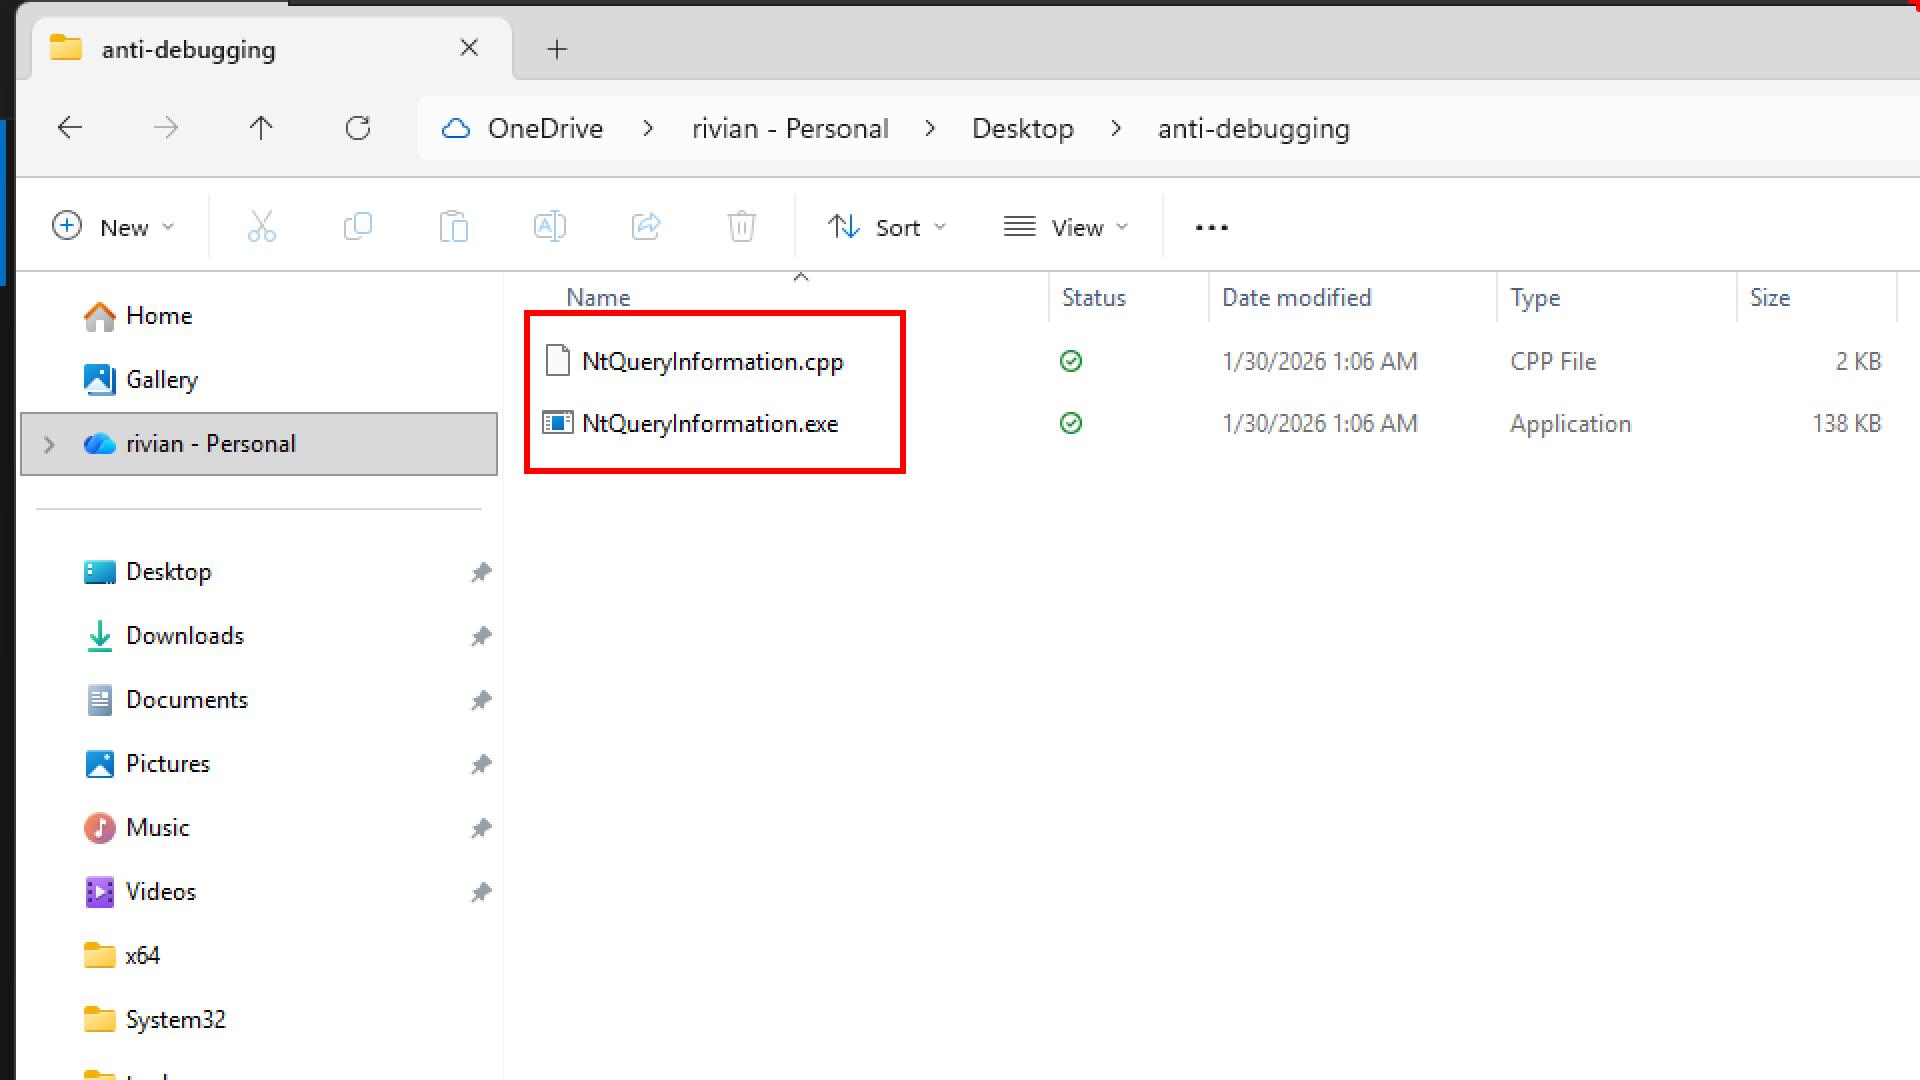
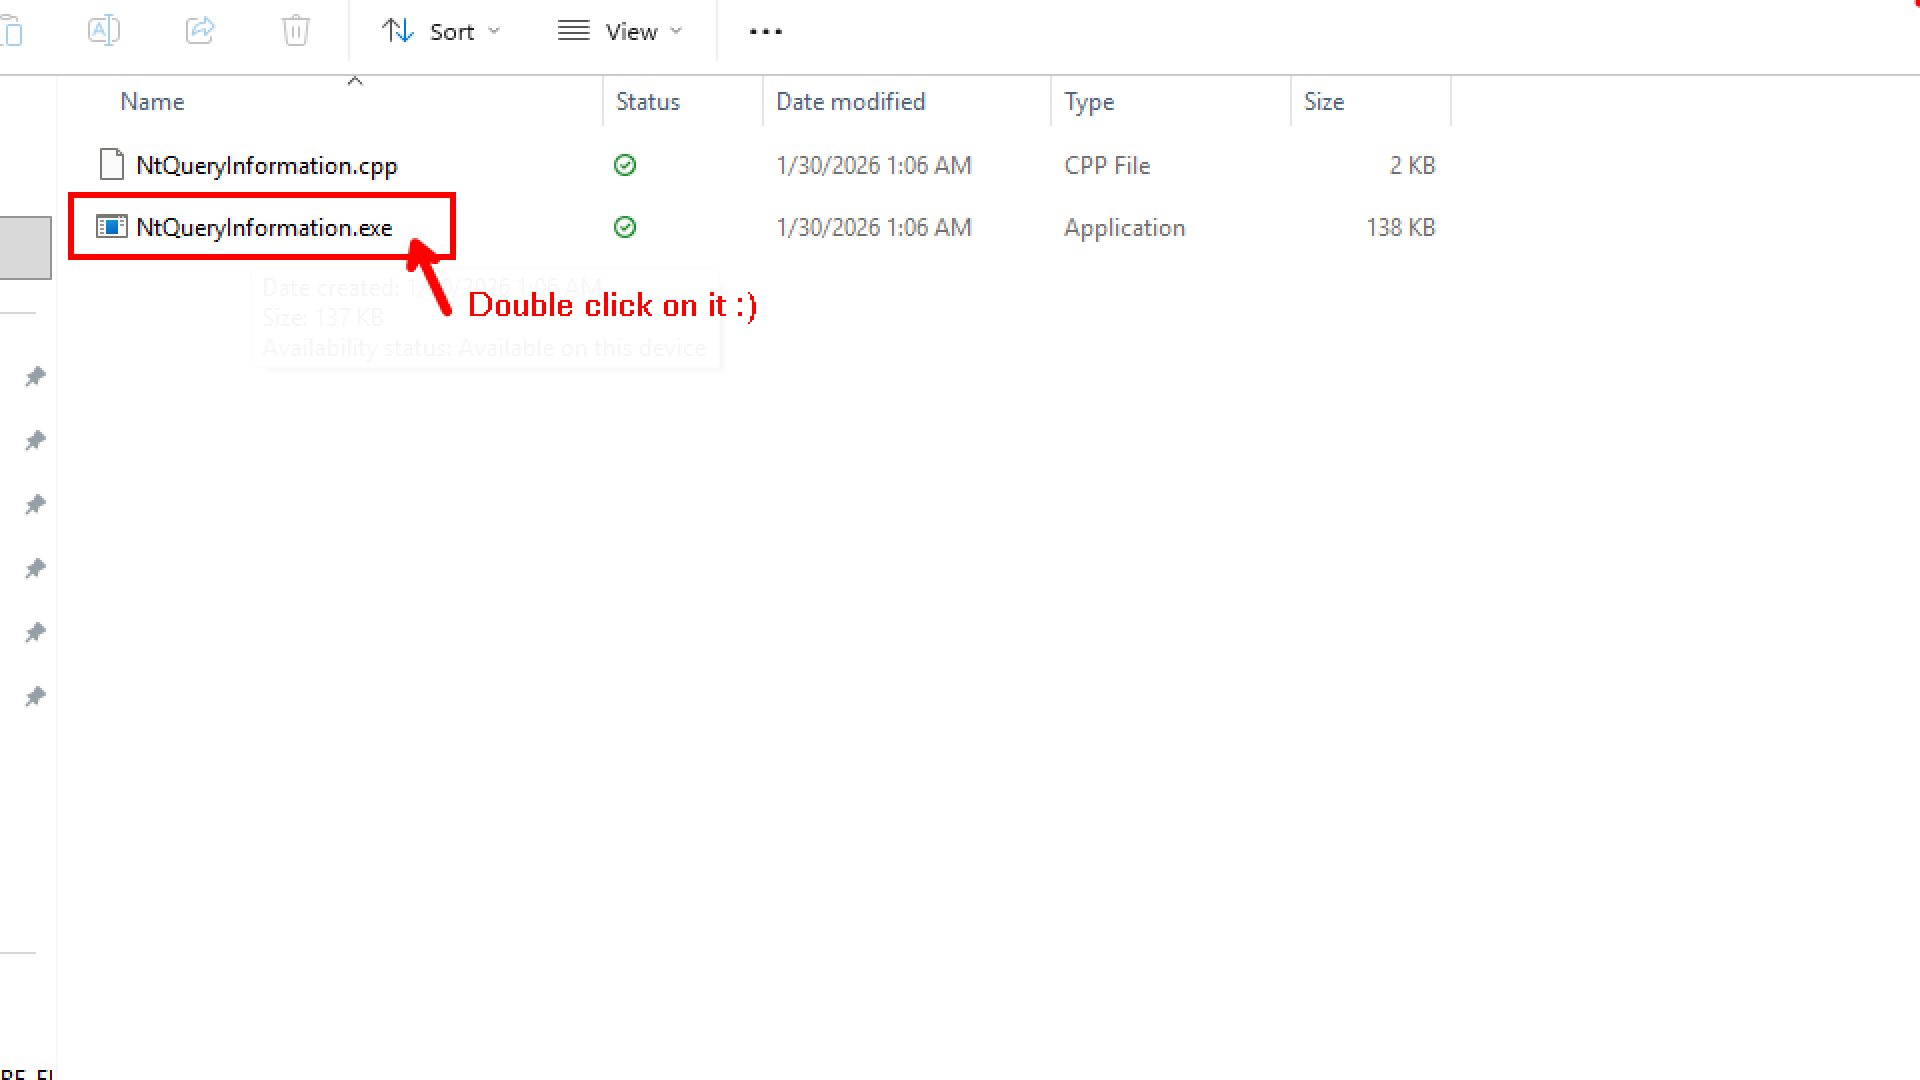
I have compiled the program and have executable on my system
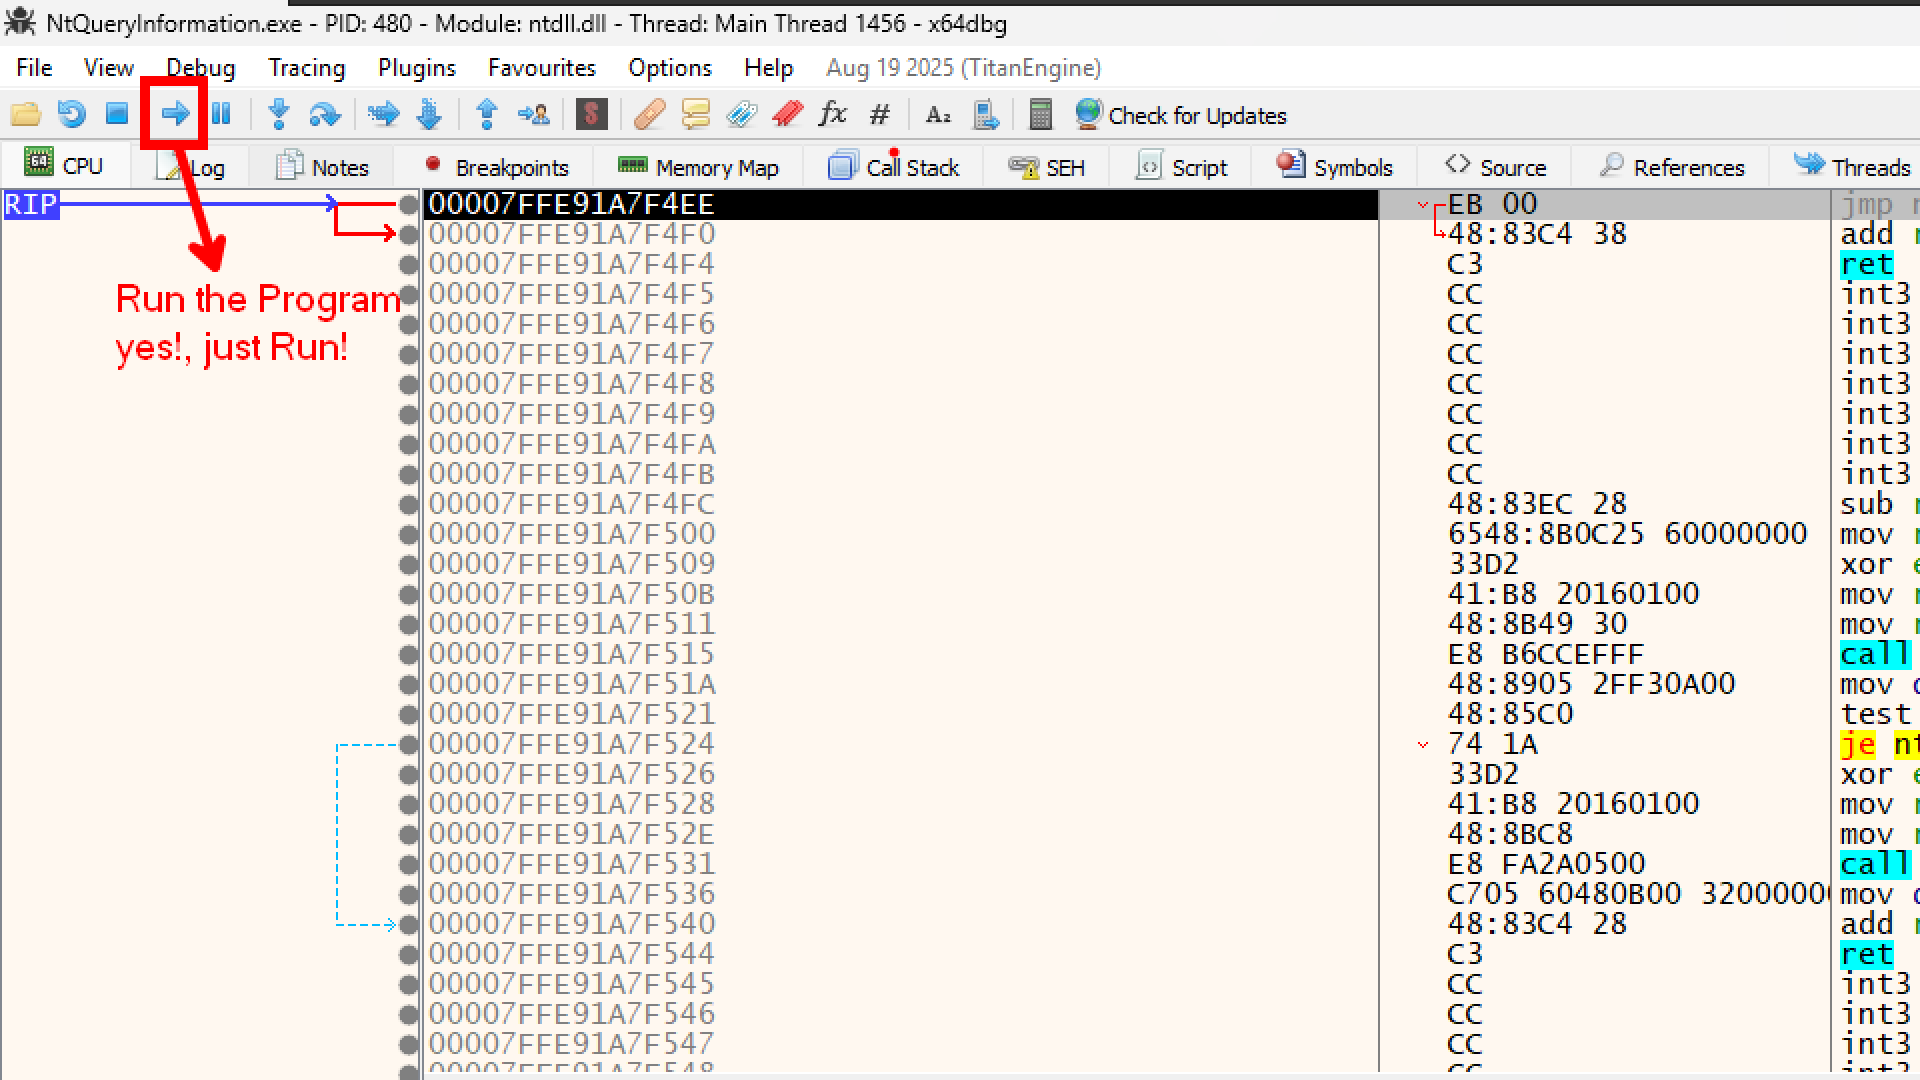
Okay let us now load our program inside x64dbg
When we first loaded the program, x64dbg paused at the Entry Point. This is a usual behaviour with x64dbg
- This is the very first line of code in your executable file.
- You aren’t looking at your code yet. You are looking at the C-Runtime (CRT) Startup code. This is standard code that the compiler (GCC) adds automatically to set up memory and variables before calling your
main()function.
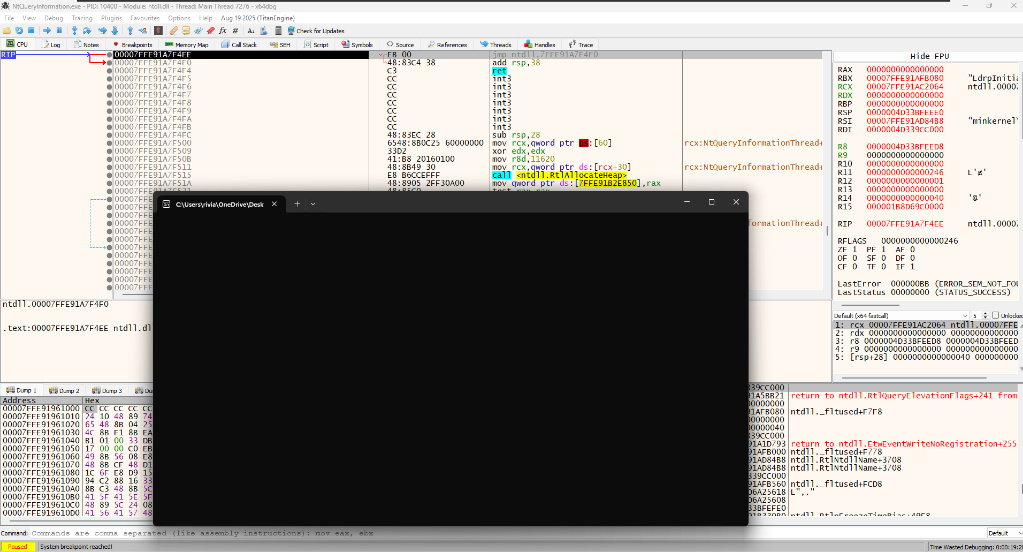
Before running our code, Windows sees “Subsystem: Console” in your file header. So, Windows automatically spawns conhost.exe (that black window) to be ready just in case you decide to print text. This happens before your code executes.
After the window appeared, x64dbg paused again at a jmp instruction inside ntdll.
- This is known as the System Breakpoint.
- Windows finished setting up the process (loading DLLs, creating the console window) and is now handing control over to the debugger. It stops inside
ntdll.dllto say, “Okay, I’m ready. Your turn.”
automatic “One-time” breakpoints that x64dbg sets by default to help you navigate the program’s startup safely.
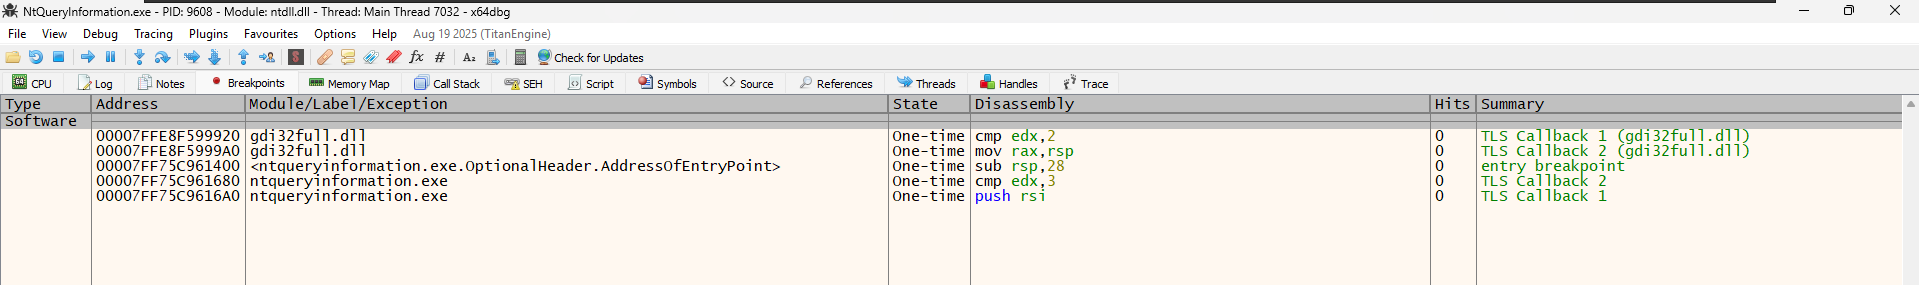
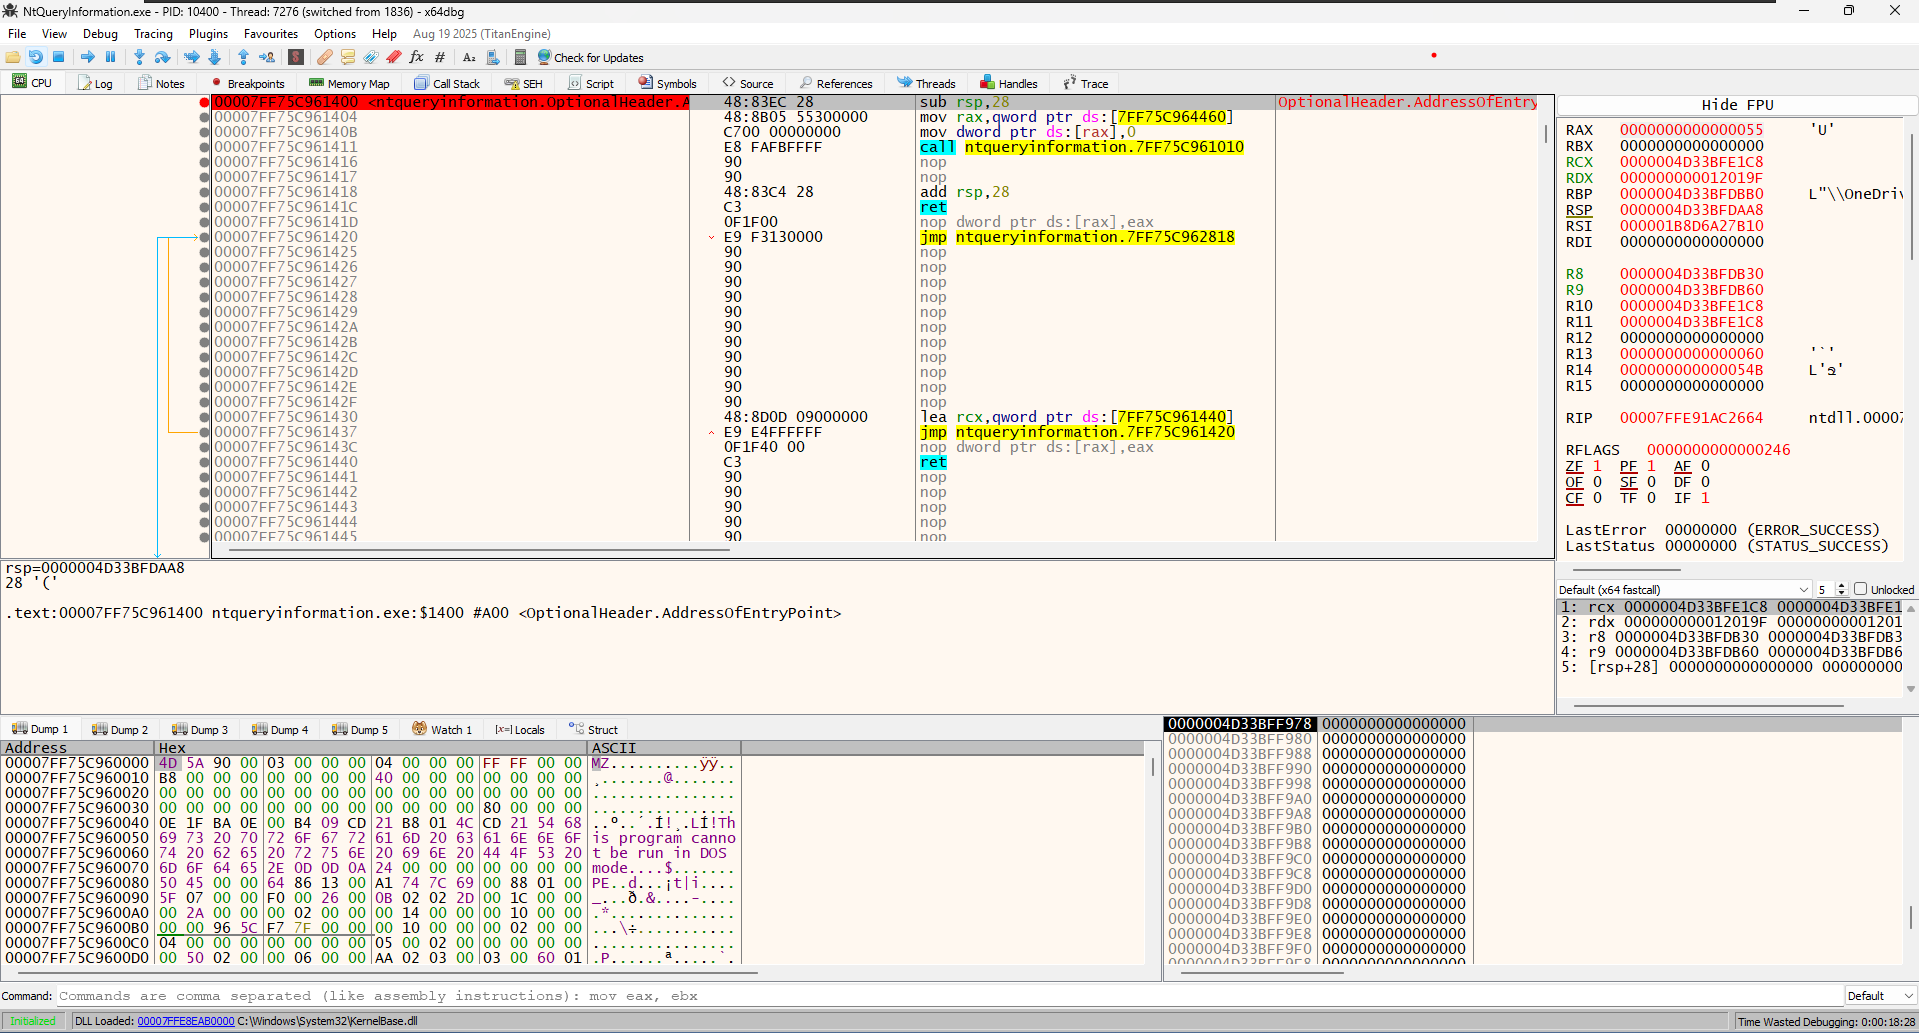
ntqueryinformation.exe.OptionalHeader.AddressOfEntryPoint. x64dbg is configured (by default) to pause execution exactly when the program starts. It places a temporary breakpoint at the “Entry Point” so you don’t miss the beginning of the code. Once you hit “Run” and pass this point, this breakpoint disappears (notice the state says “One-time”).
The “TLS Callbacks”
- We see entries labeled
TLS Callback 1 andTLS Callback 2. - TLS (Thread Local Storage) Callbacks are special functions that run before the Entry Point. Malware often hides code here to run secretly before a debugger expects it.
- x64dbg is smart. It automatically scans for these hidden callbacks and puts breakpoints on them so you don’t accidentally skip over malicious or important setup code.
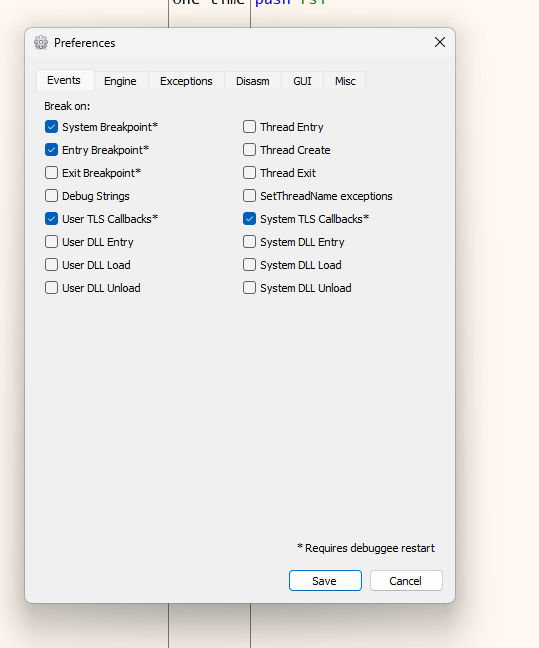
But we dont need these breakpoints for our experiment, therefore you can remove these breakpoints, on x64dbg just by right clicking on it you will get the option to remove all the breakpoints.
You can also disable this behavior if you want by going to Options -> Preferences -> Events and unchecking “Entry Breakpoint” or “TLS Callbacks”.
Alright, i guess we just diverted a little bit with our agenda!, no problem i guess its always important to understand what we see basics are very important thats what makes the foundation. Enough gyaan!!
Okay now lets try to understand this function more
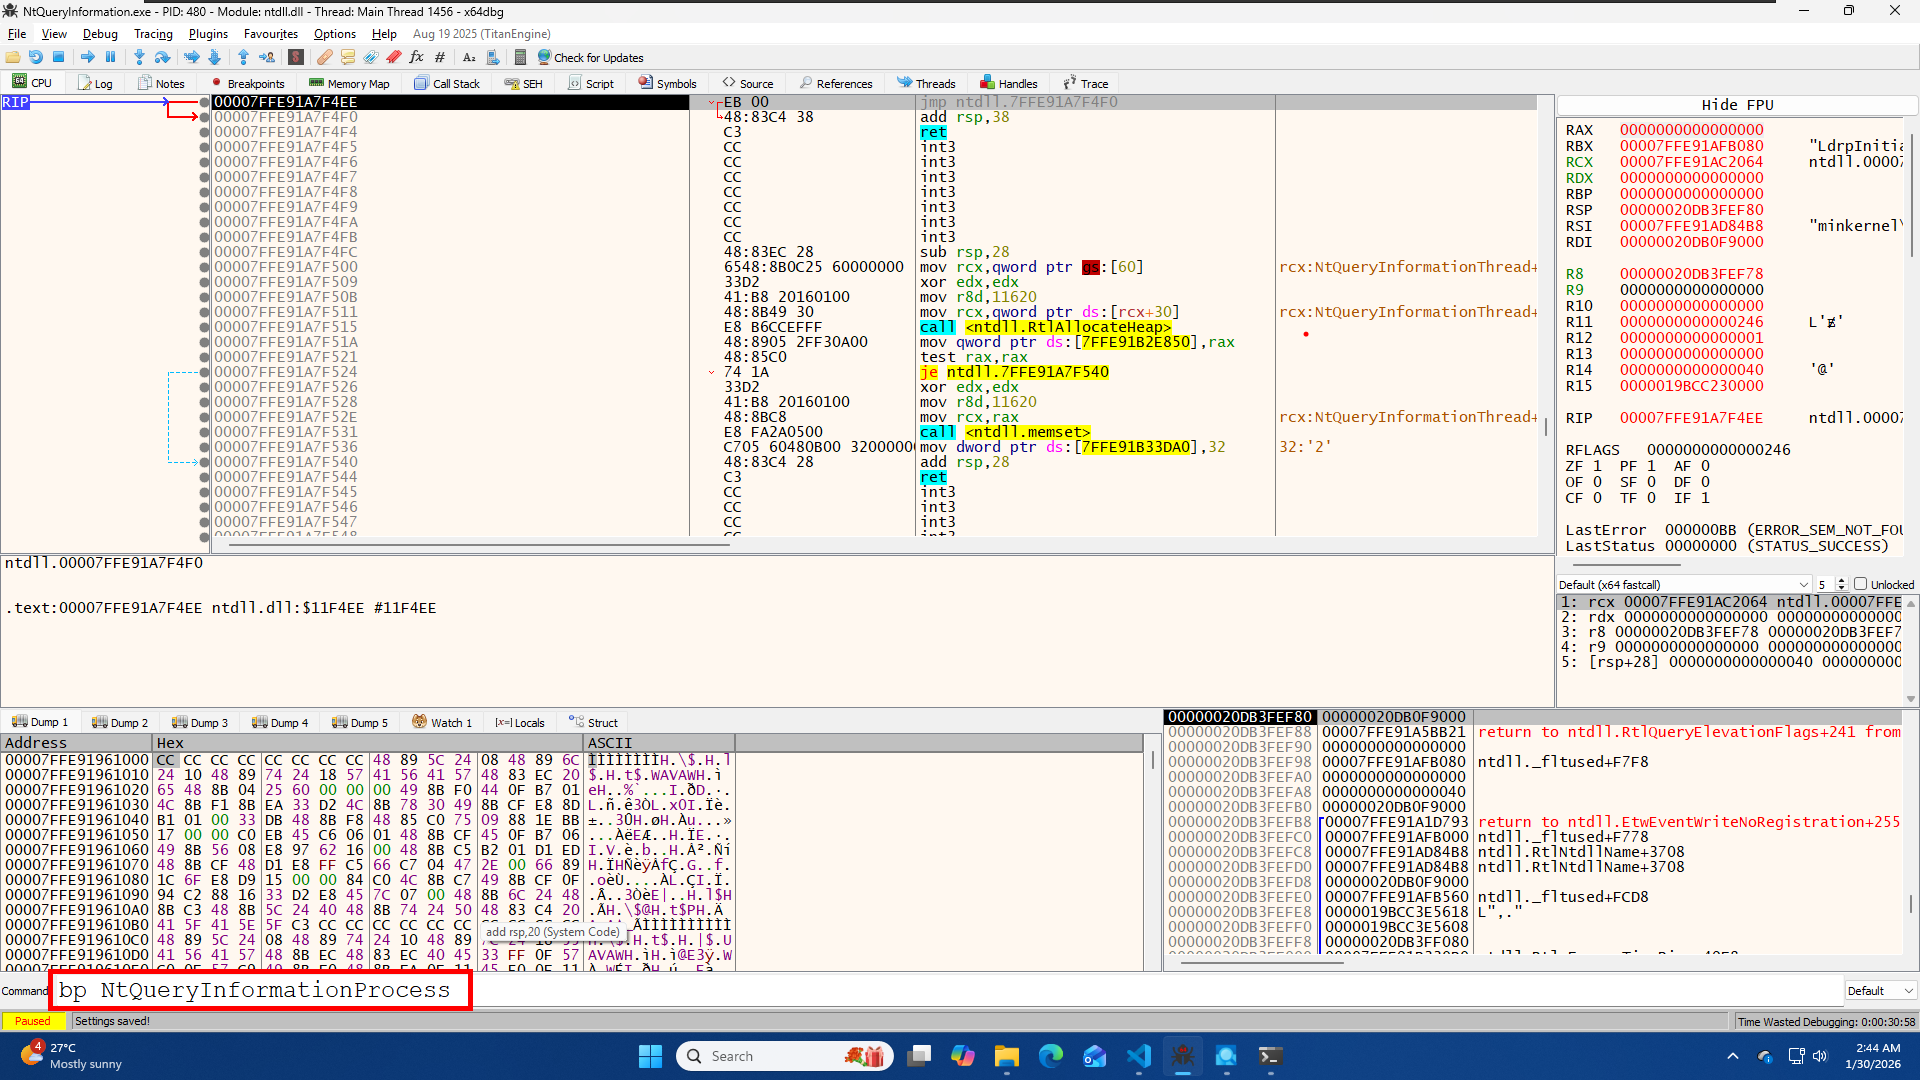
You can add a breakpoint by using the bp command
bp NtQueryInformationProcess
or by
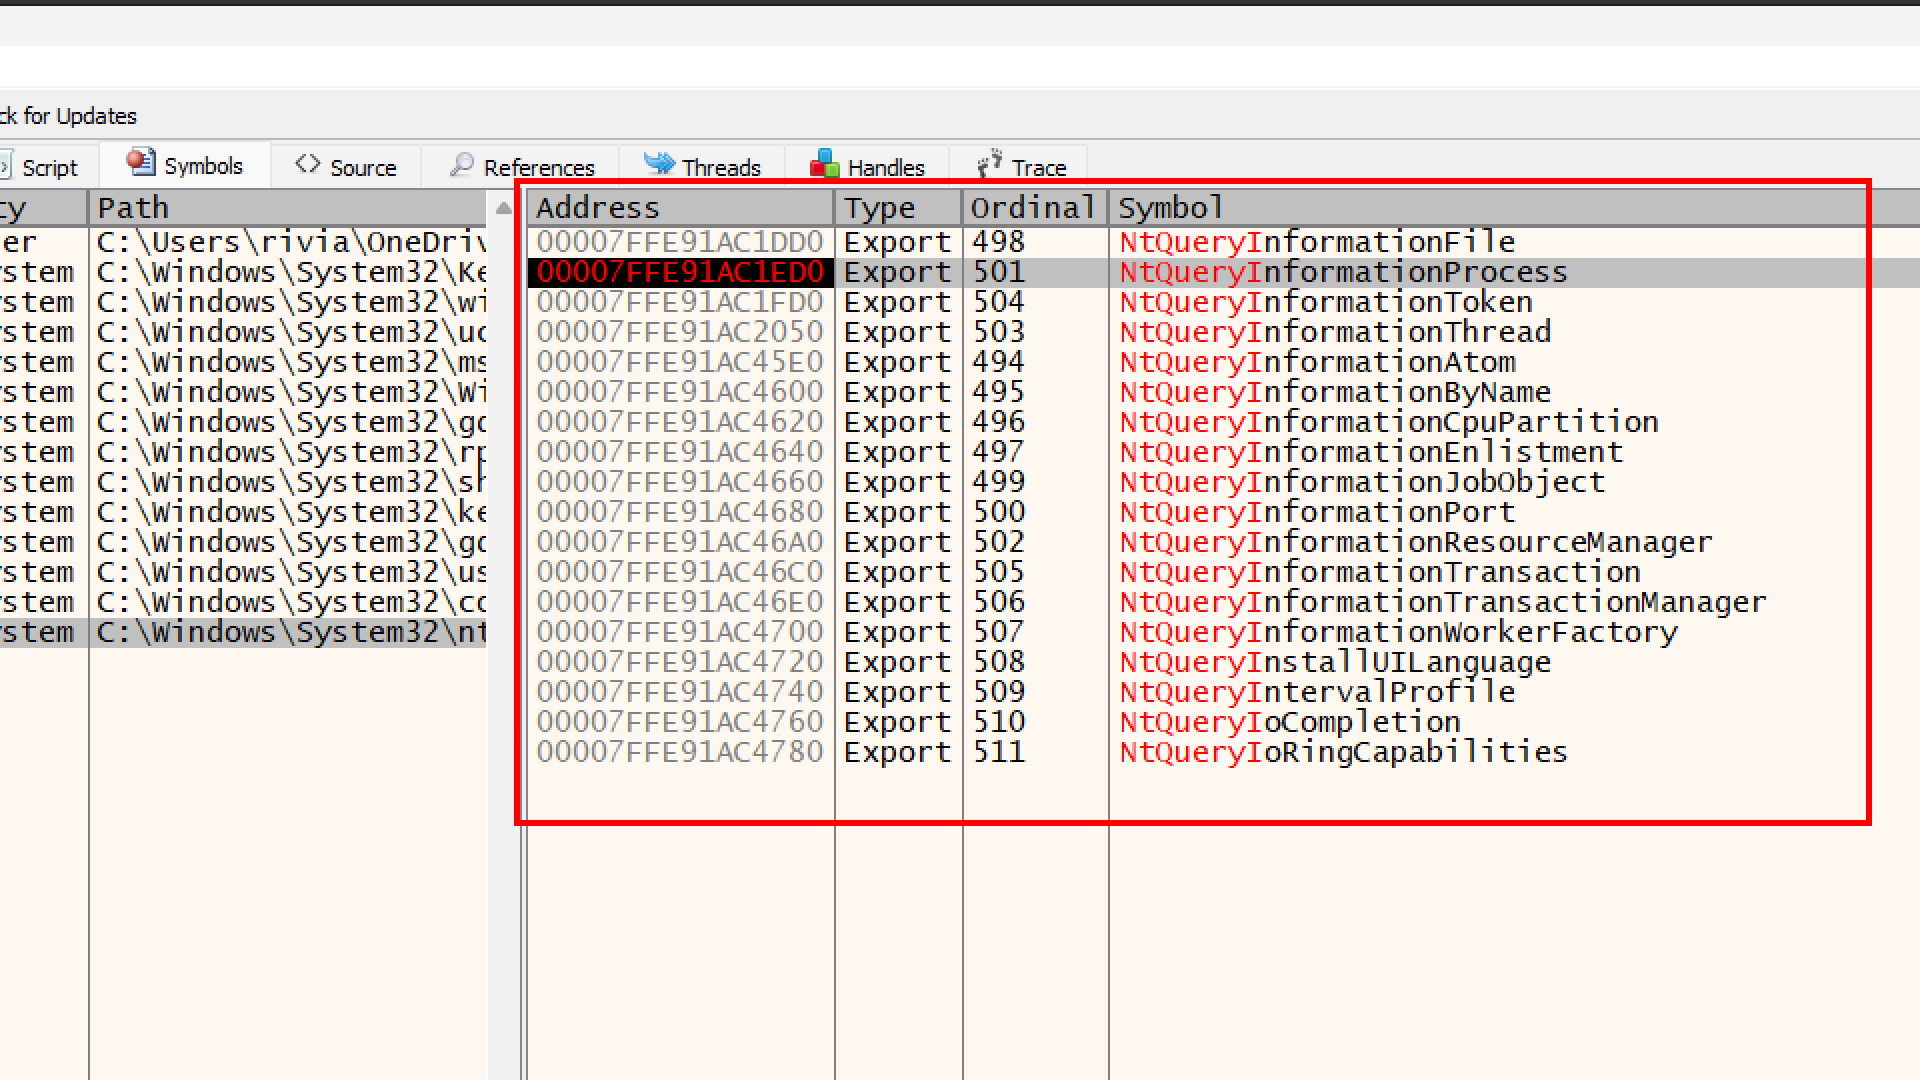
- In x64dbg, click the Symbols tab (top bar).
- On the left side (Modules), find and click on
ntdll.dll. - On the right side (Functions), type
NtQueryInformationProcessin the search bar. - You will see
NtQueryInformationProcess. Press F2 to set a breakpoint on it (it will turn red).
Run the program, and it shoud hit the BreakPoint
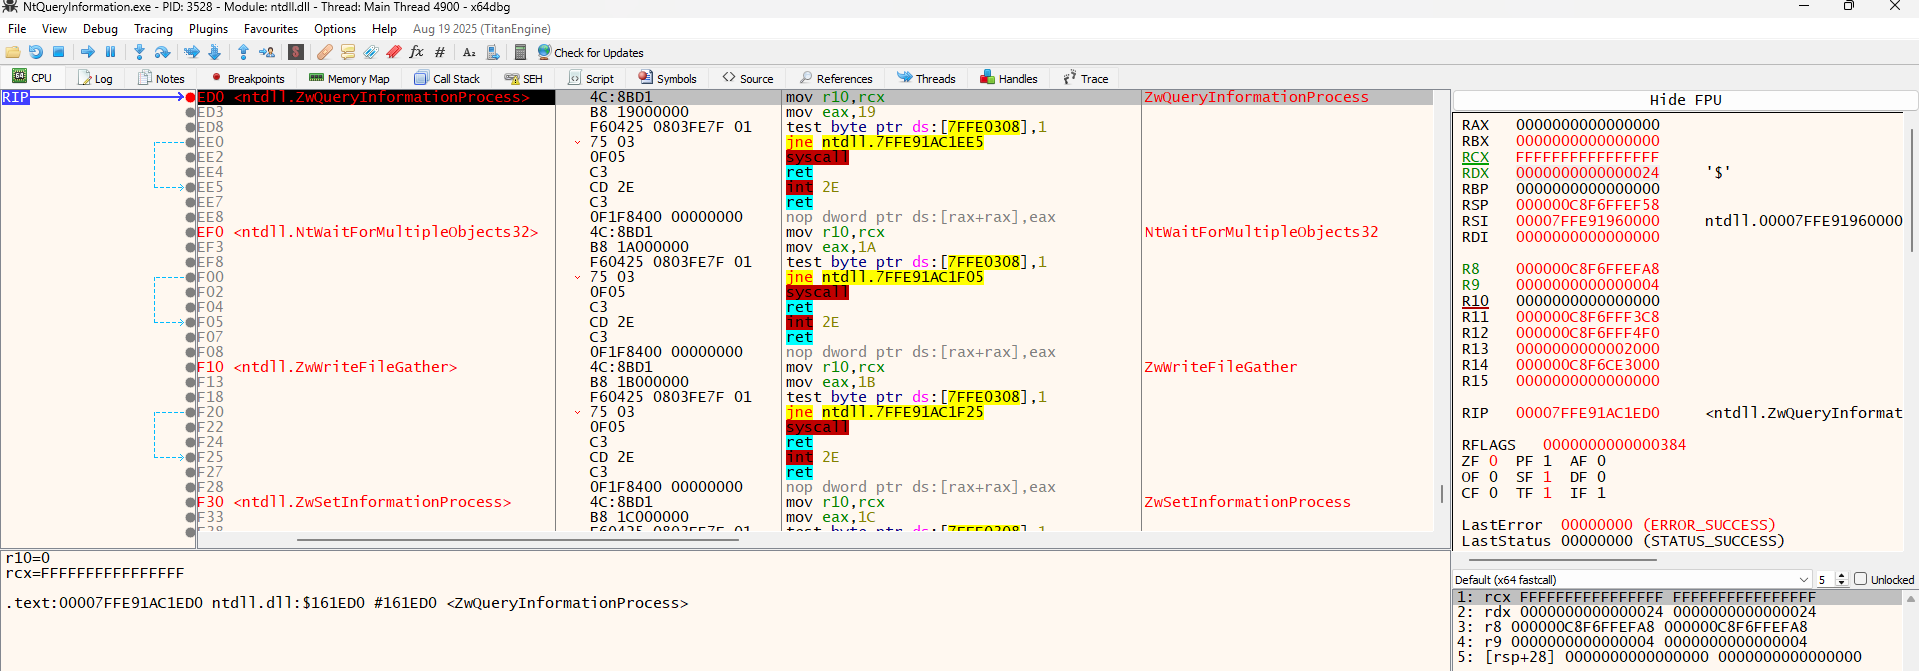
Well, the RDX register (the 2nd parameter) is 0000...0024 (which is 36 in decimal), not 7. So something is wrong here.
And this was the Answer i got
Windows calls NtQueryInformationProcess internally many times while your program is starting up (to check file names, paths, etc.). You hit a breakpoint on one of those internal Windows checks, specifically ProcessImageFileName (Value 36), which Windows uses to find where your .exe is located.
Basically we need to skip these internal calls and find the specific one our code makes.
We can tell x64dbg to ignore everything unless the value in RDX is exactly 7.
- Right-click the red dot (breakpoint) next to the instruction
ntdll.ZwQueryInformationProcess. - Select Edit Breakpoint (or Shift + F2).
- In the “Condition” box, type exactly this:
RDX == 7 - Click Save.
- Press F9 (Run) .
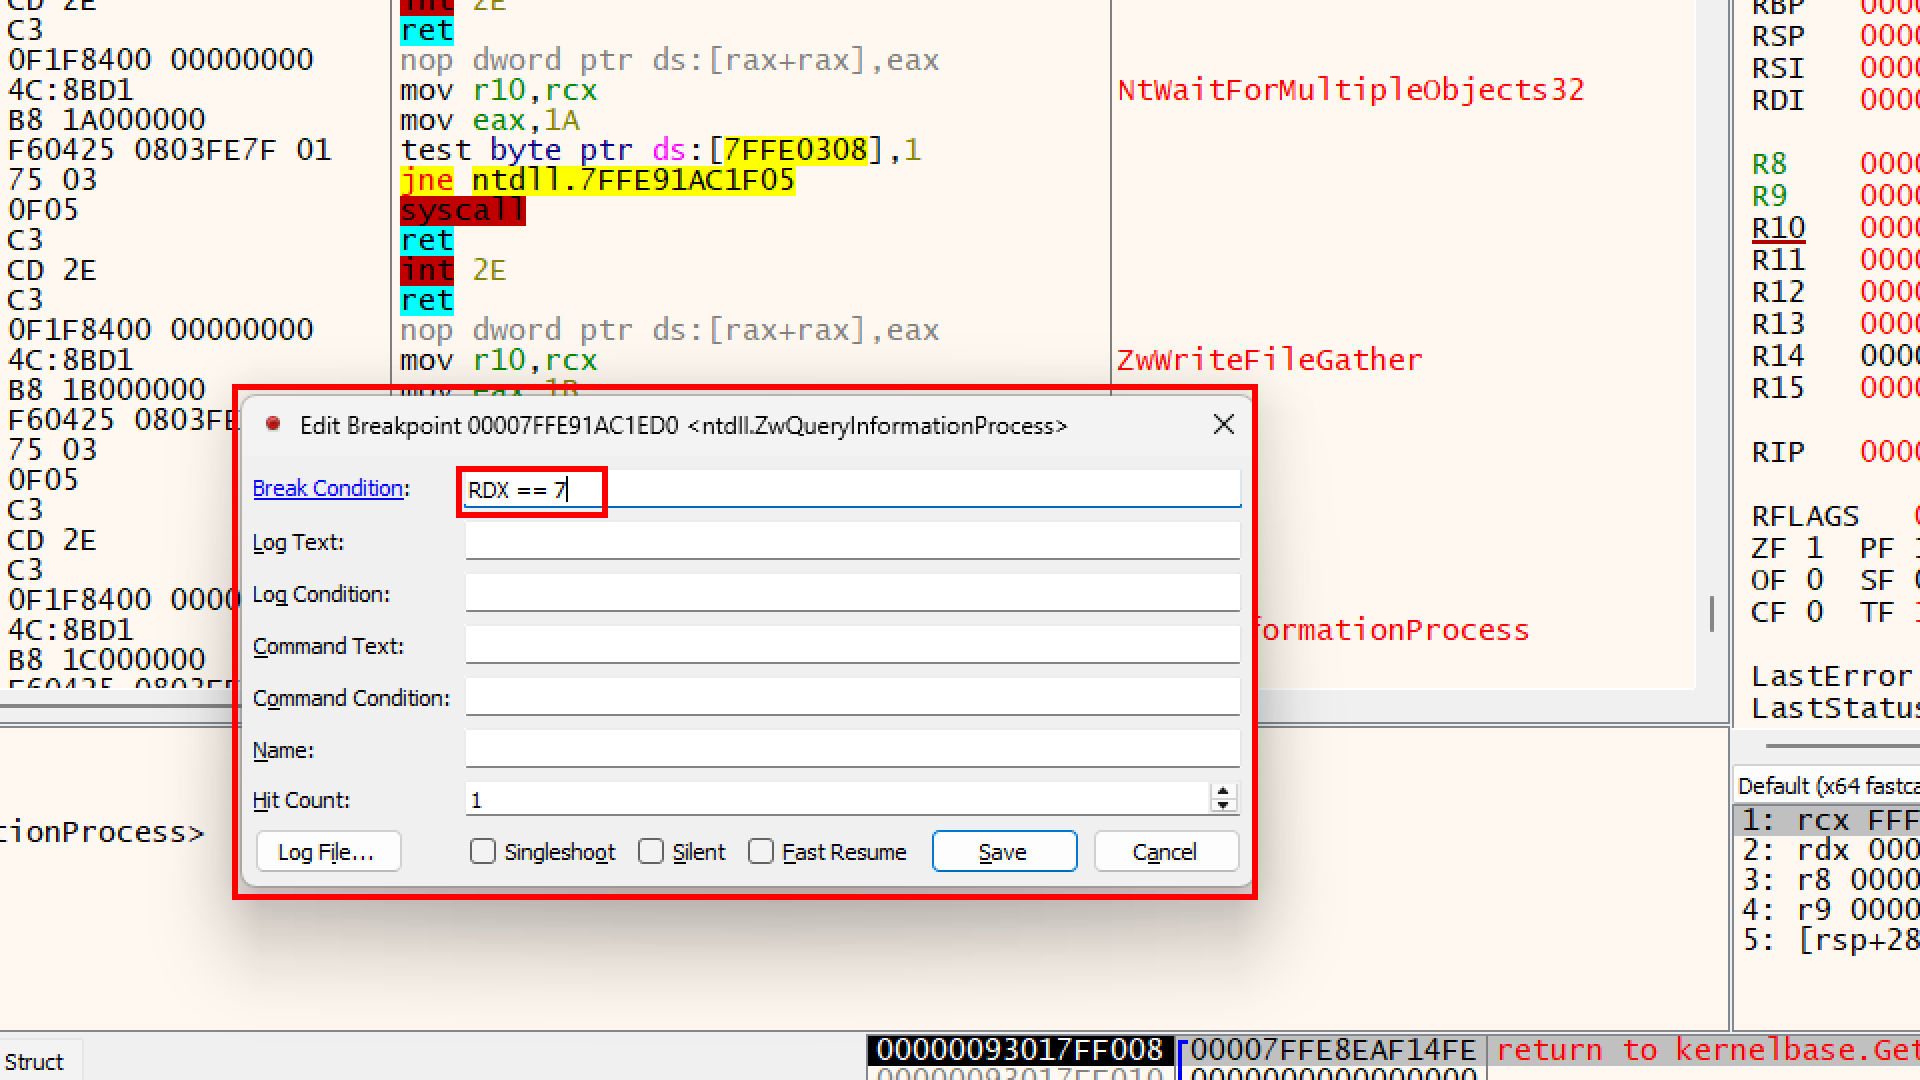
Basically You are telling x64dbg: “I don’t care about any other time this function is called. Only wake me up when the second parameter (RDX) is equal to 7.”
yayy!!
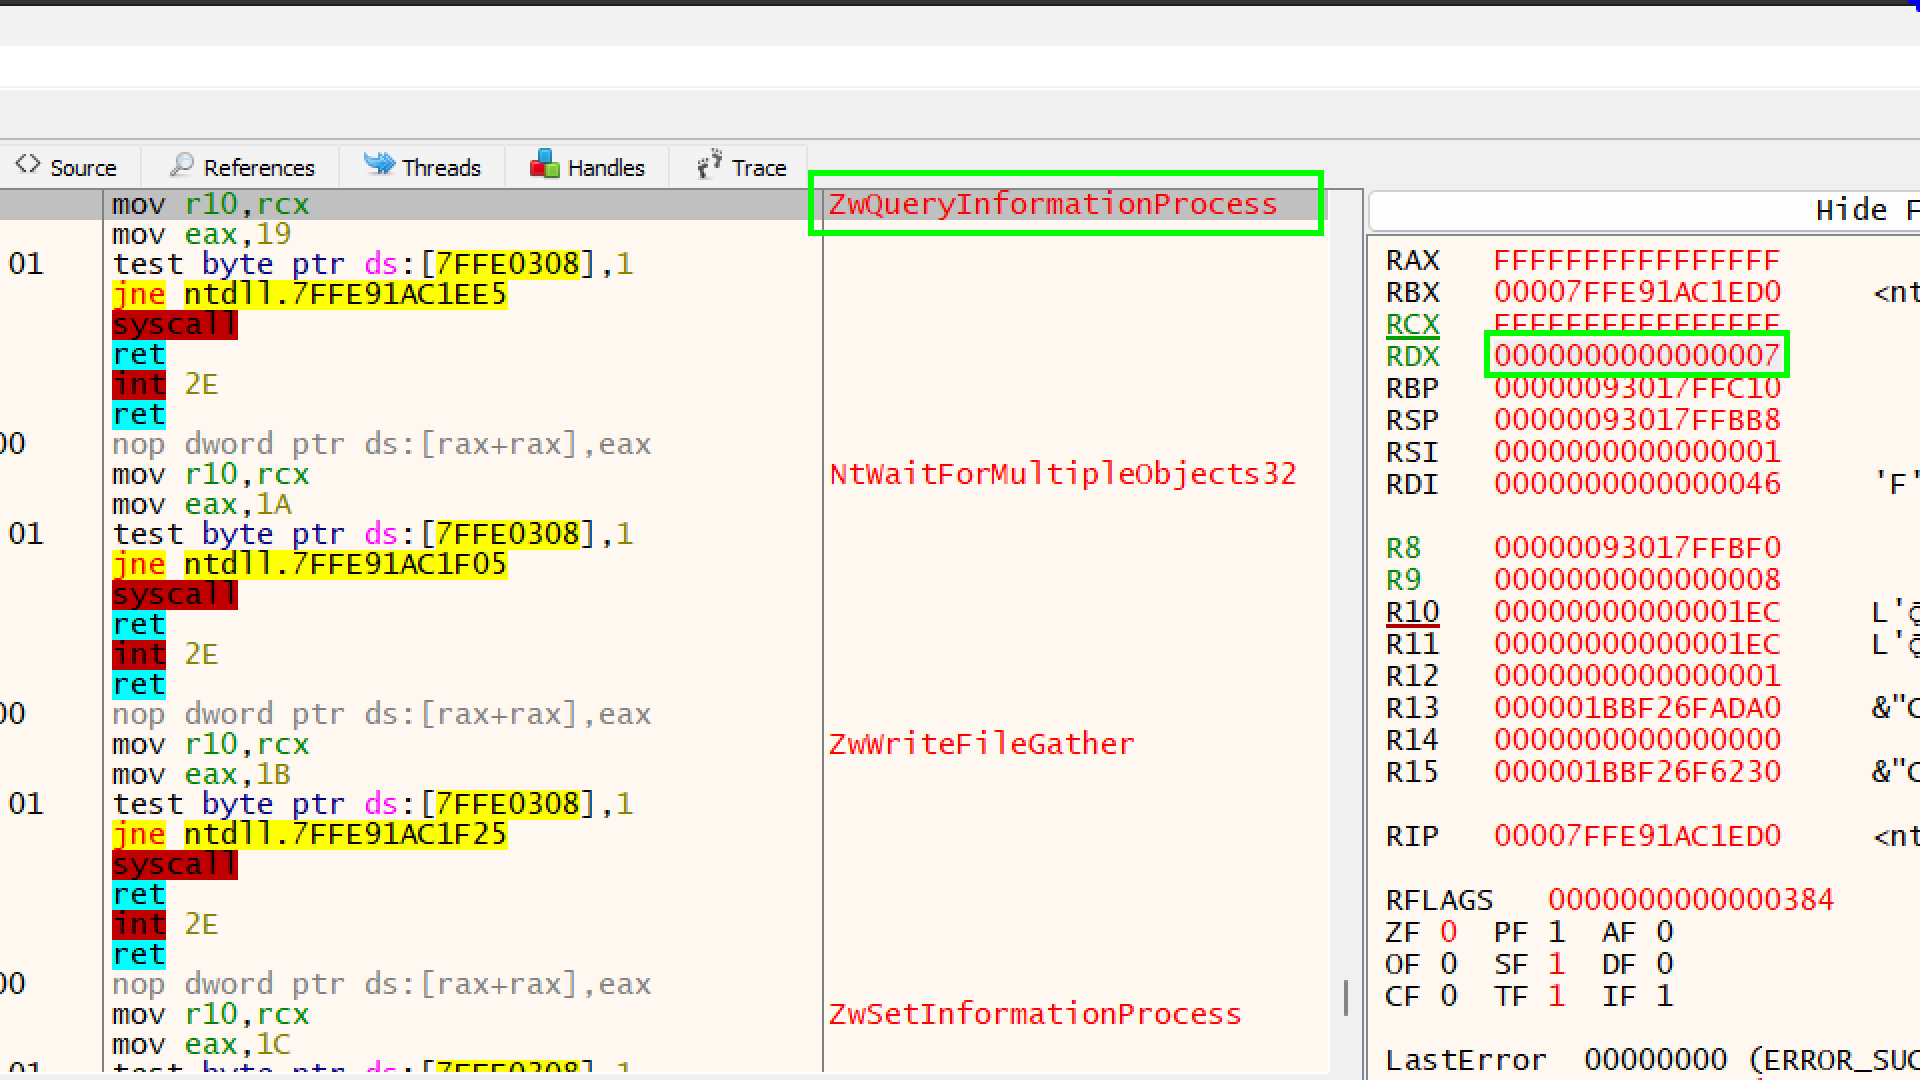
RCX has the value FFFFFFFFFFFFFFFF (-1).
- This represents
GetCurrentProcess(). It just tells Windows “Check this running program.”
RDX has the value 7
- Checking for Debug Port
R8 ( has a memory address, 00000093017FFBF0.
- This is the Pointer. Think of it as a mailbox. Windows hasn’t put the letter (the answer) inside yet.
Dump the Memory address of R8 in Dump1
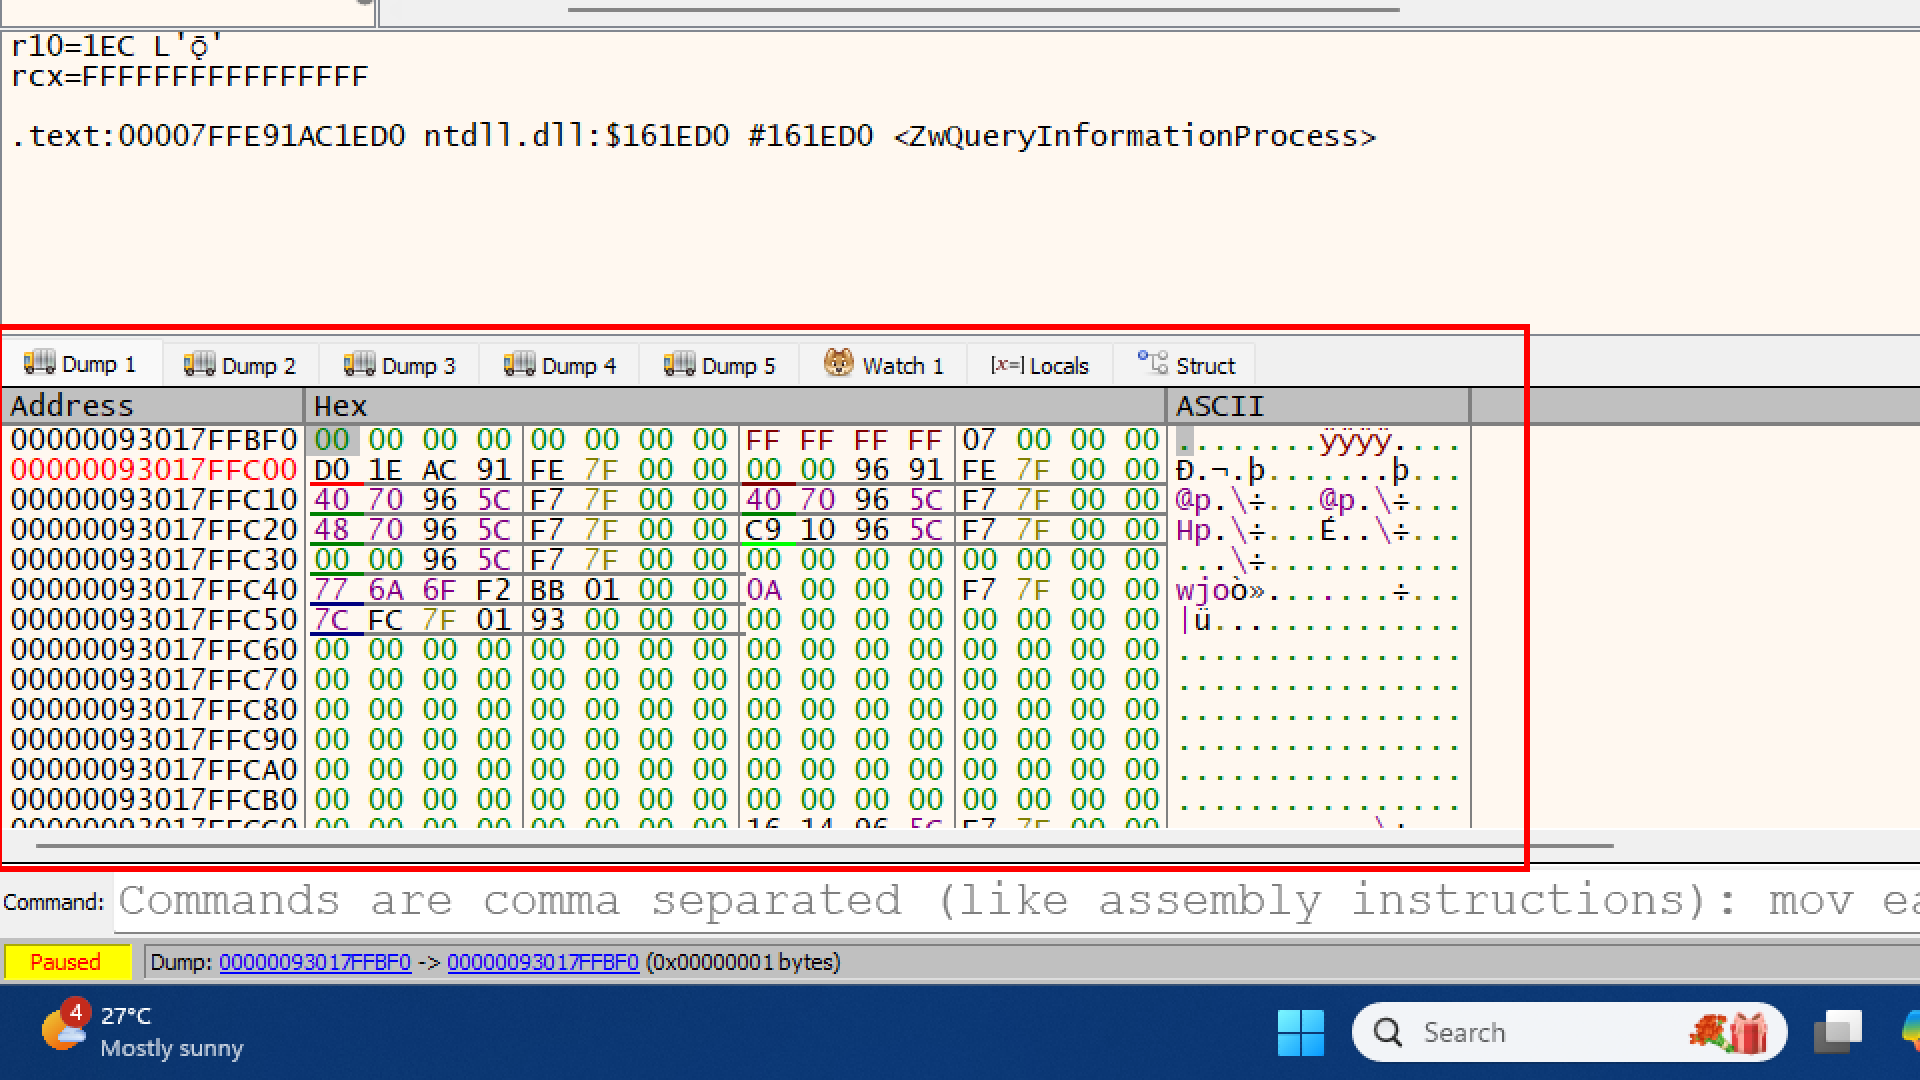 you can see the first few bytes are
 00 00 00 00. This is happening because the function has not run yet,
we need to let the function finish its job so it can write to that memory.
Press Ctrl + F9 on your keyboard (or go to Debug -> Execute till Return).
This tells the debugger: “Run this function and stop just before you go back to the main program.”
Okay, here it becomes interesting
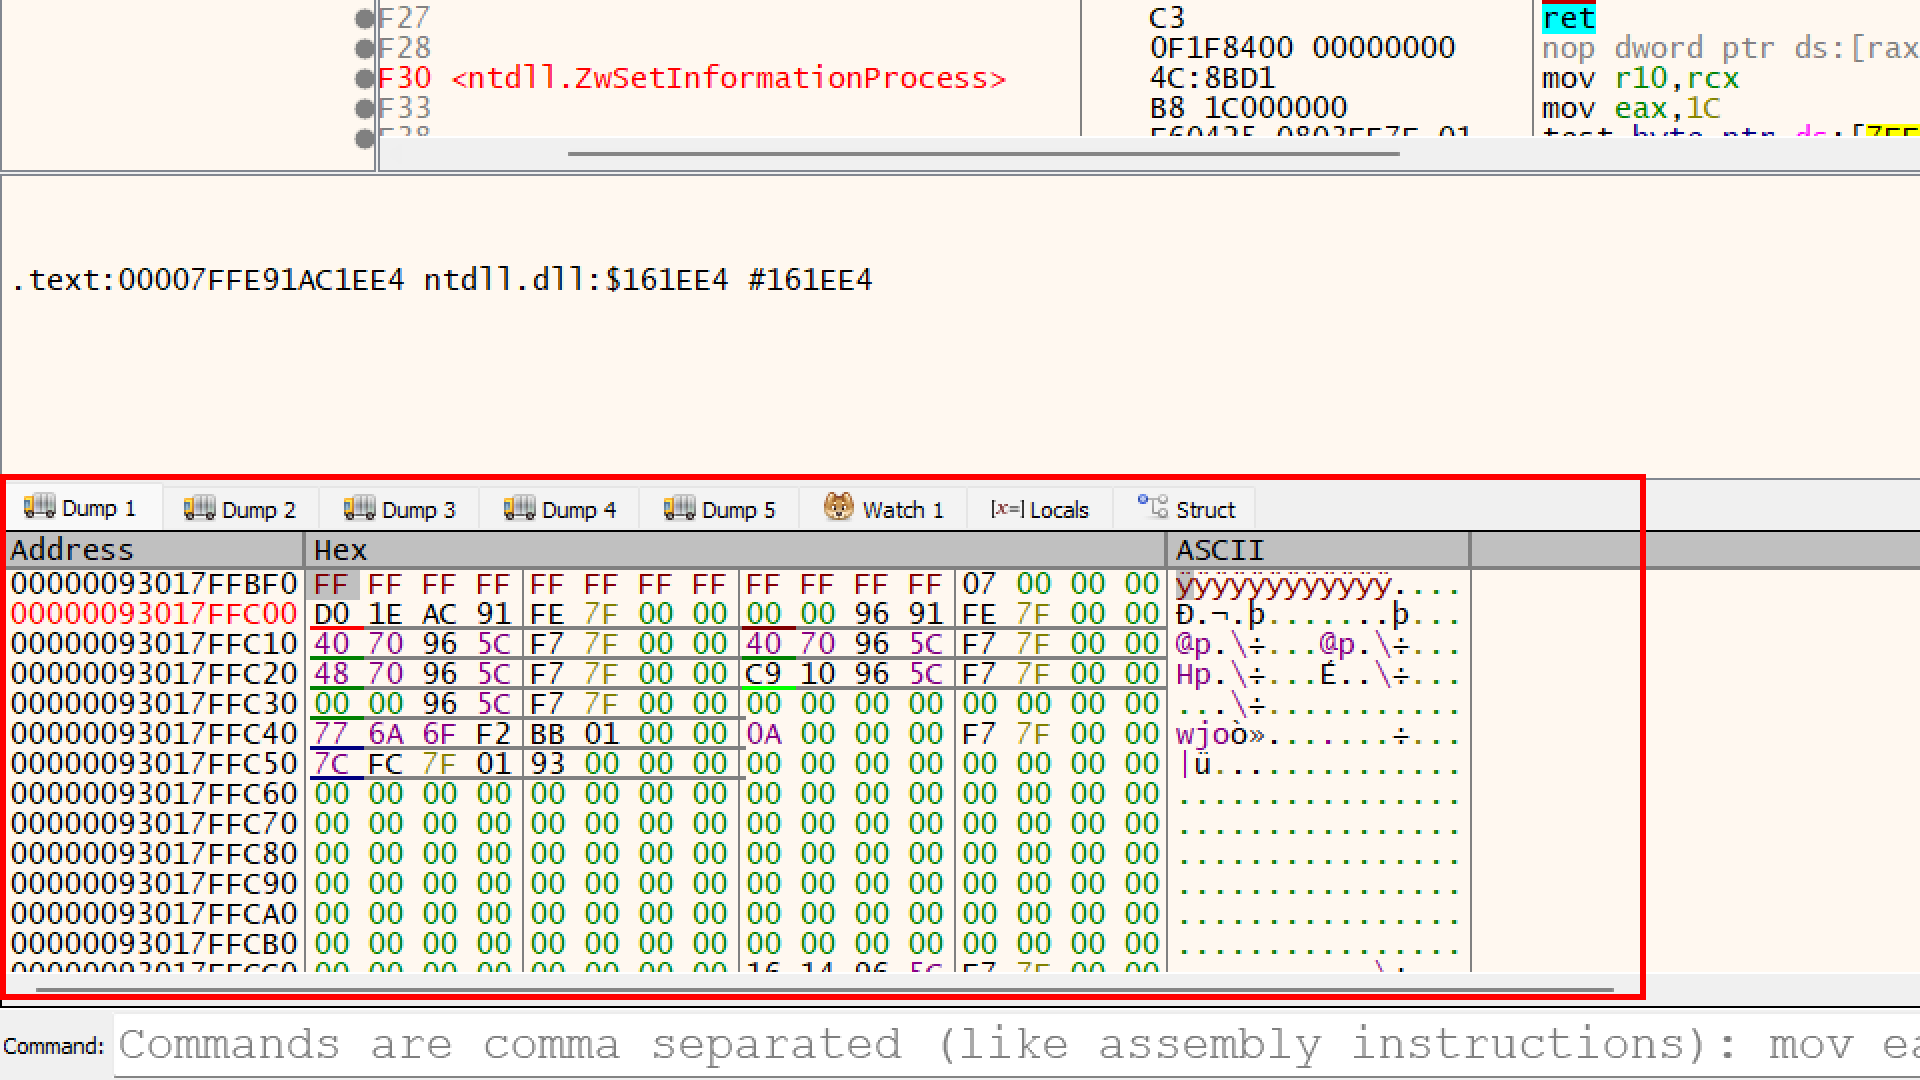
The memory address 00000093017FFBF0 is now filled with FF FF FF FF... .
- Before: It was
00 00 00 00(Clean/Safe). - Now: It is
FF FF FF FF (which is -1 in computer math).
If we press F9 (Run) right now, our C++ code will read this -1.
- It checks:
if (debugPort != 0)? - True (-1 is not 0).
- It enters the
ifblock. - Result: You get the “Running me inside a Debugger” message box.
But we dont want that, we want the program to open calculator
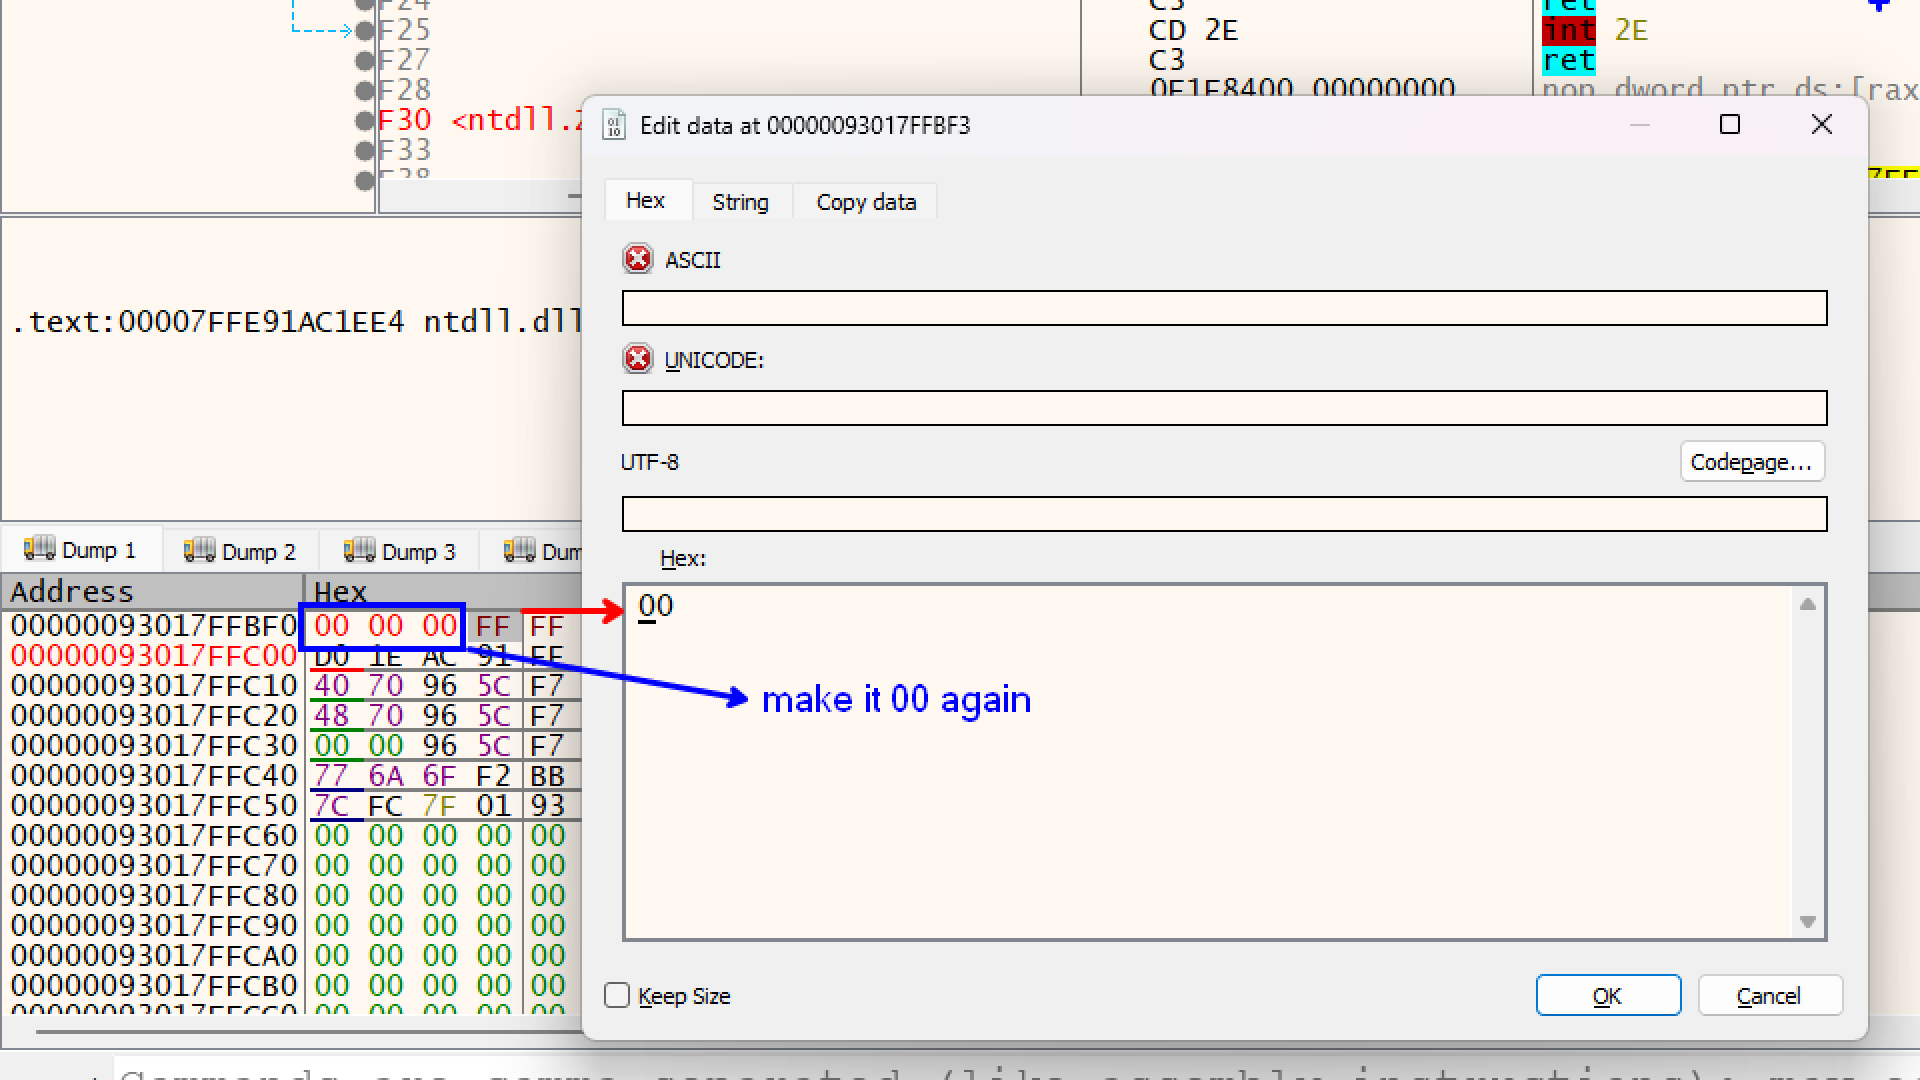
By changing those FF bytes back to 00, we are effectively lying to the program.
- our program looks at that variable
debugPort. - Instead of seeing the
-1 (Debugger Detected) that Windows put there, it sees your fake0(Safe).