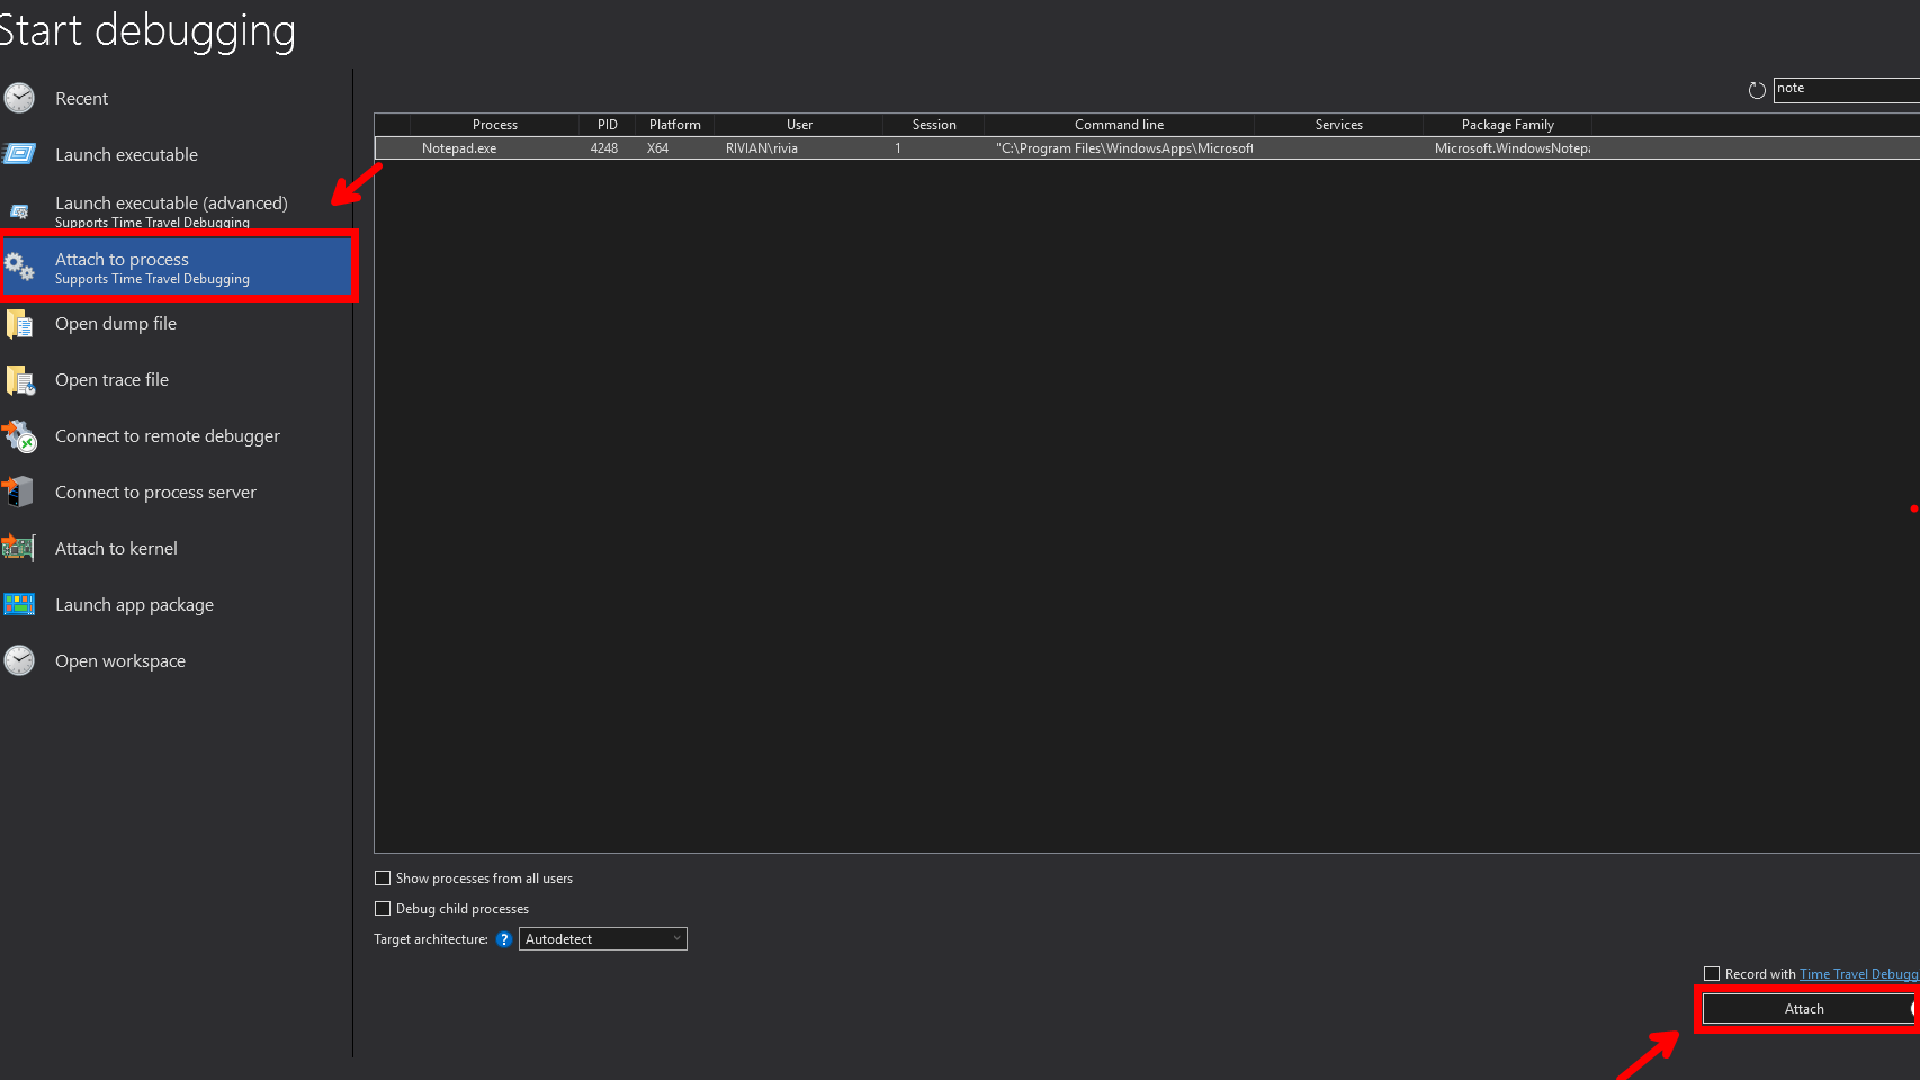
The way to start Debugging in User Mode is in one of two ways:
- Attach to an existing Process then start looking into it.
- Launch an executable which will create a process based on that executable and attach to it immediately
Let’s start with the first option, Attach to an existing Process
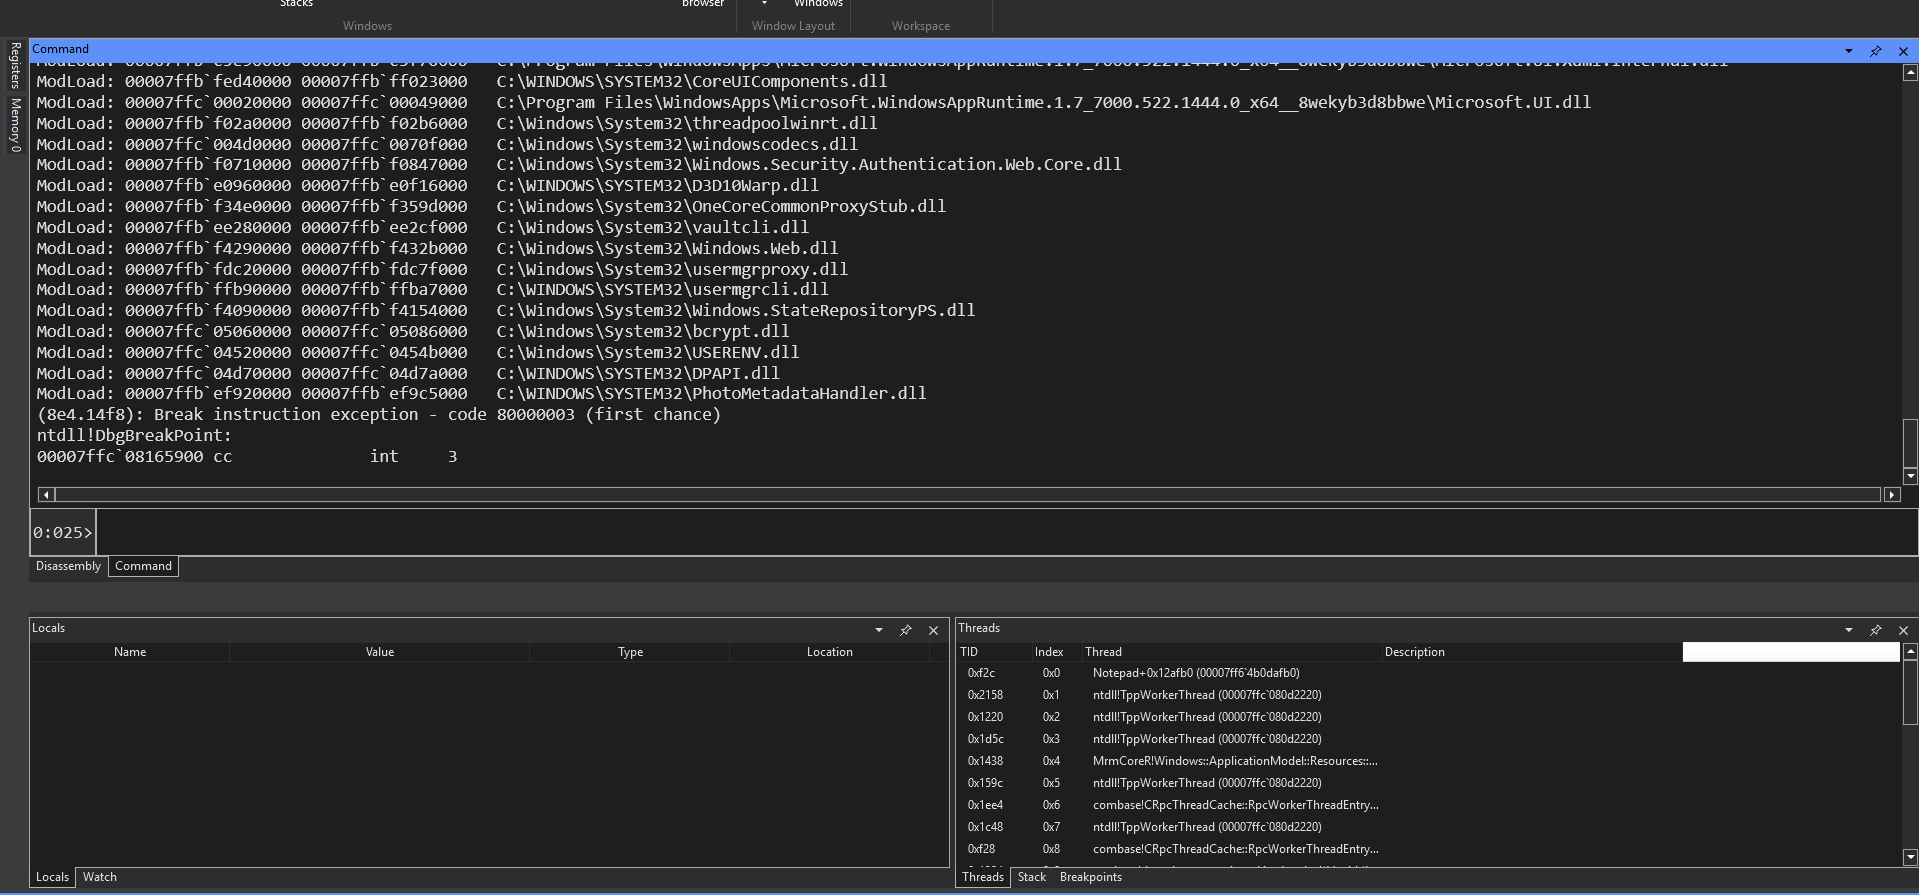
Notepad can no longer run any code because all the threads in notepad are suspended.
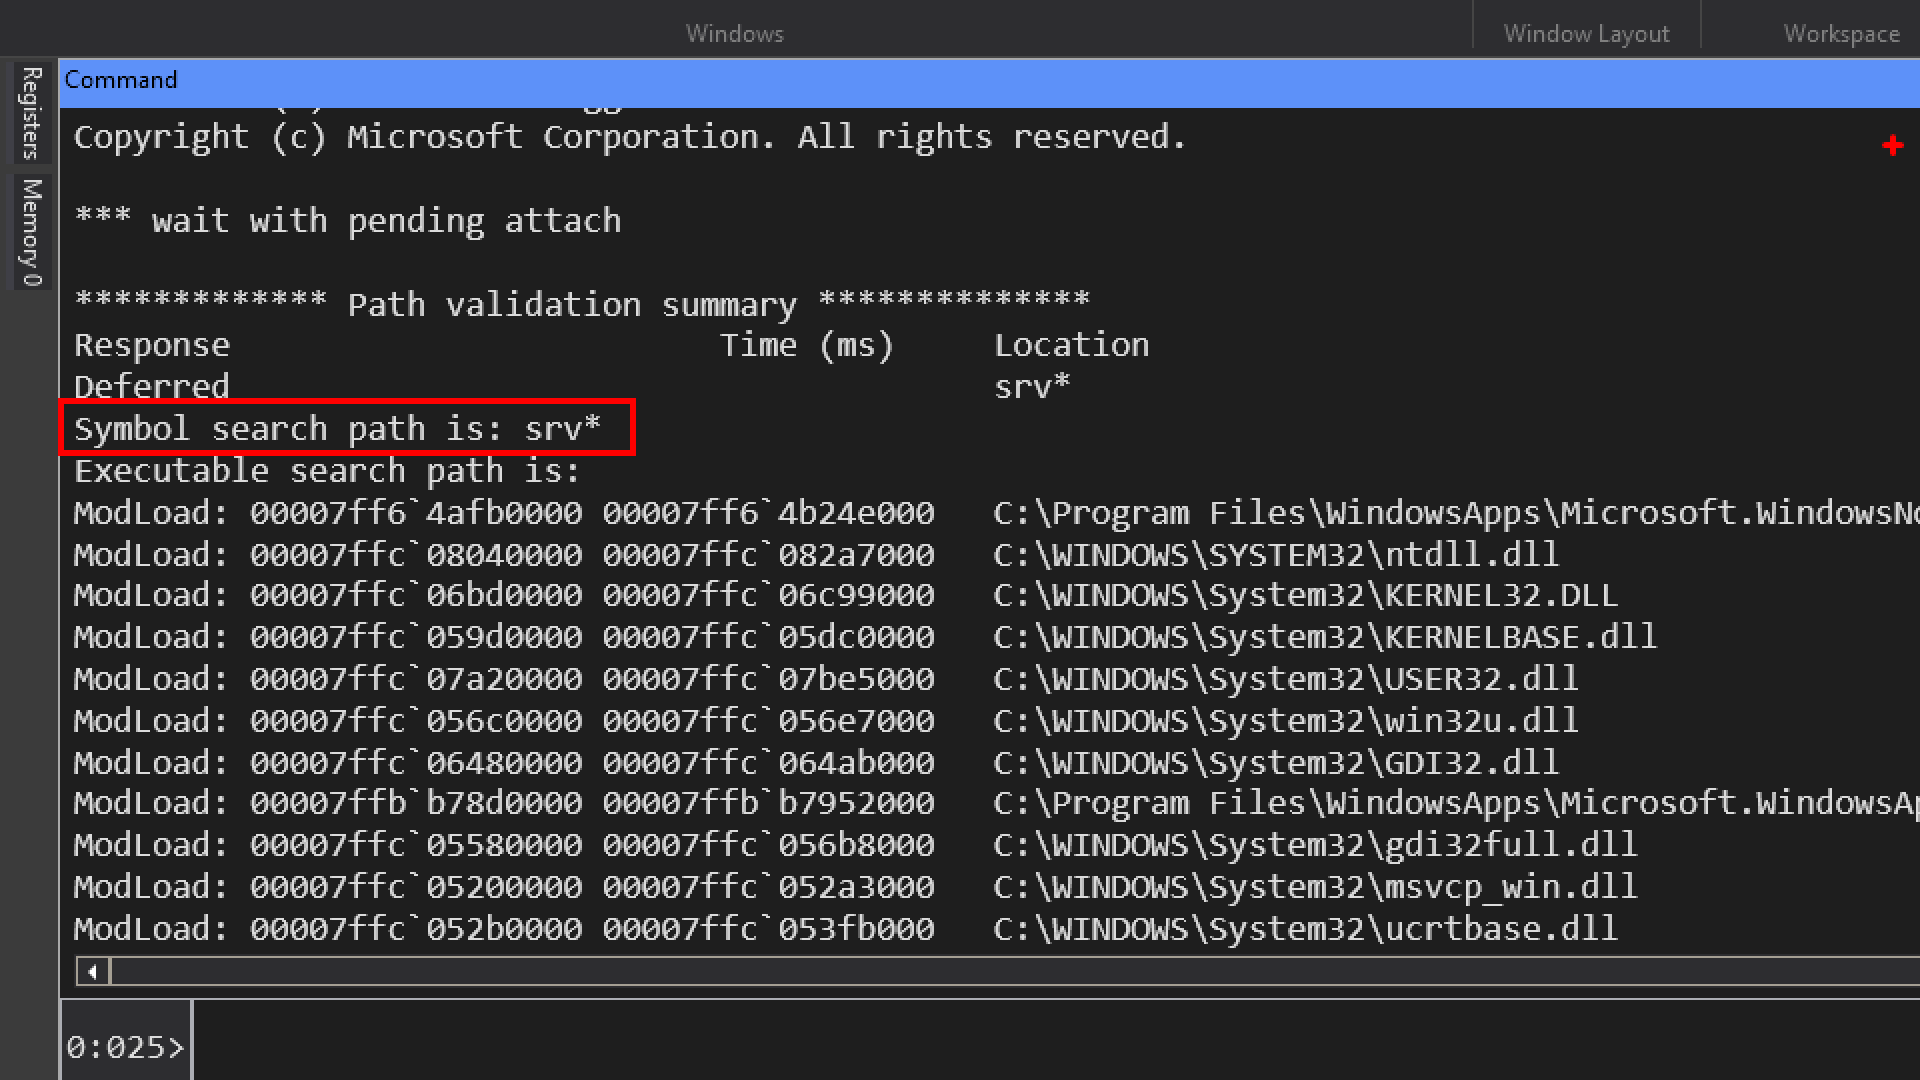
srv* : default symbol path that says download symbols from the microsoft symbol server and cache them somewhere on disk.
The View section gives you quick access to all the main windows and layout controls. Let’s break down each option:
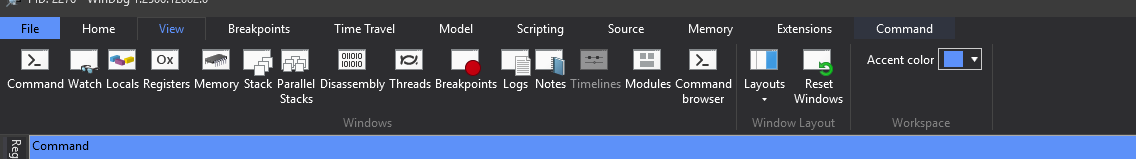
- Command: The most important window. This is the interactive command line where you type in debugger commands (
.cls,g,k,lm, etc.) and see the output. - Watch: Allows you to add and watch the values of specific variables or expressions. This is similar to the Locals window but gives you more control over what you’re monitoring.
- Locals: Automatically displays the local variables of the function currently executing. As you step through code, the values of these variables are updated and highlighted.
- Registers: Shows the current values of the CPU’s registers (e.g., RAX, RBX, RCX, RIP, RSP). This is crucial for low-level debugging.
- Memory: A hexadecimal and ASCII dump of the process’s memory. You can use this to inspect the raw contents of any memory address.
- Stack: Displays the call stack, showing the sequence of function calls that led to the current instruction pointer. This is essential for understanding the program’s flow.
- Parallel Stacks: A specialized view for multi-threaded applications, showing the call stacks of all threads in the process at once, which can help in visualizing deadlocks or race conditions.
- Disassembly: Shows the raw machine code (assembly instructions) of the program. This is the lowest level of code view and is critical for debugging when source code is not available.
- Threads: Lists all the threads running in the debugged process. You can use this window to switch between threads to inspect their individual stacks and state.
- Breakpoints: A convenient list of all the breakpoints you have set. From here, you can enable, disable, or delete them.
- Logs: A window that displays internal WinDbg logs. This can be useful for troubleshooting the debugger itself or for monitoring long-running operations.
- Notes: A simple scratchpad where you can write down notes or reminders during your debugging session.
- Timelines: A feature for Time Travel Debugging (TTD) that visually represents events (like breakpoints) over the execution history of a program.
- Modules: Lists all the DLLs and executables (modules) that are currently loaded into the process’s memory. This view includes information like the base address, size, and version of each module.
- Command Browser: A searchable list of all available debugger commands.
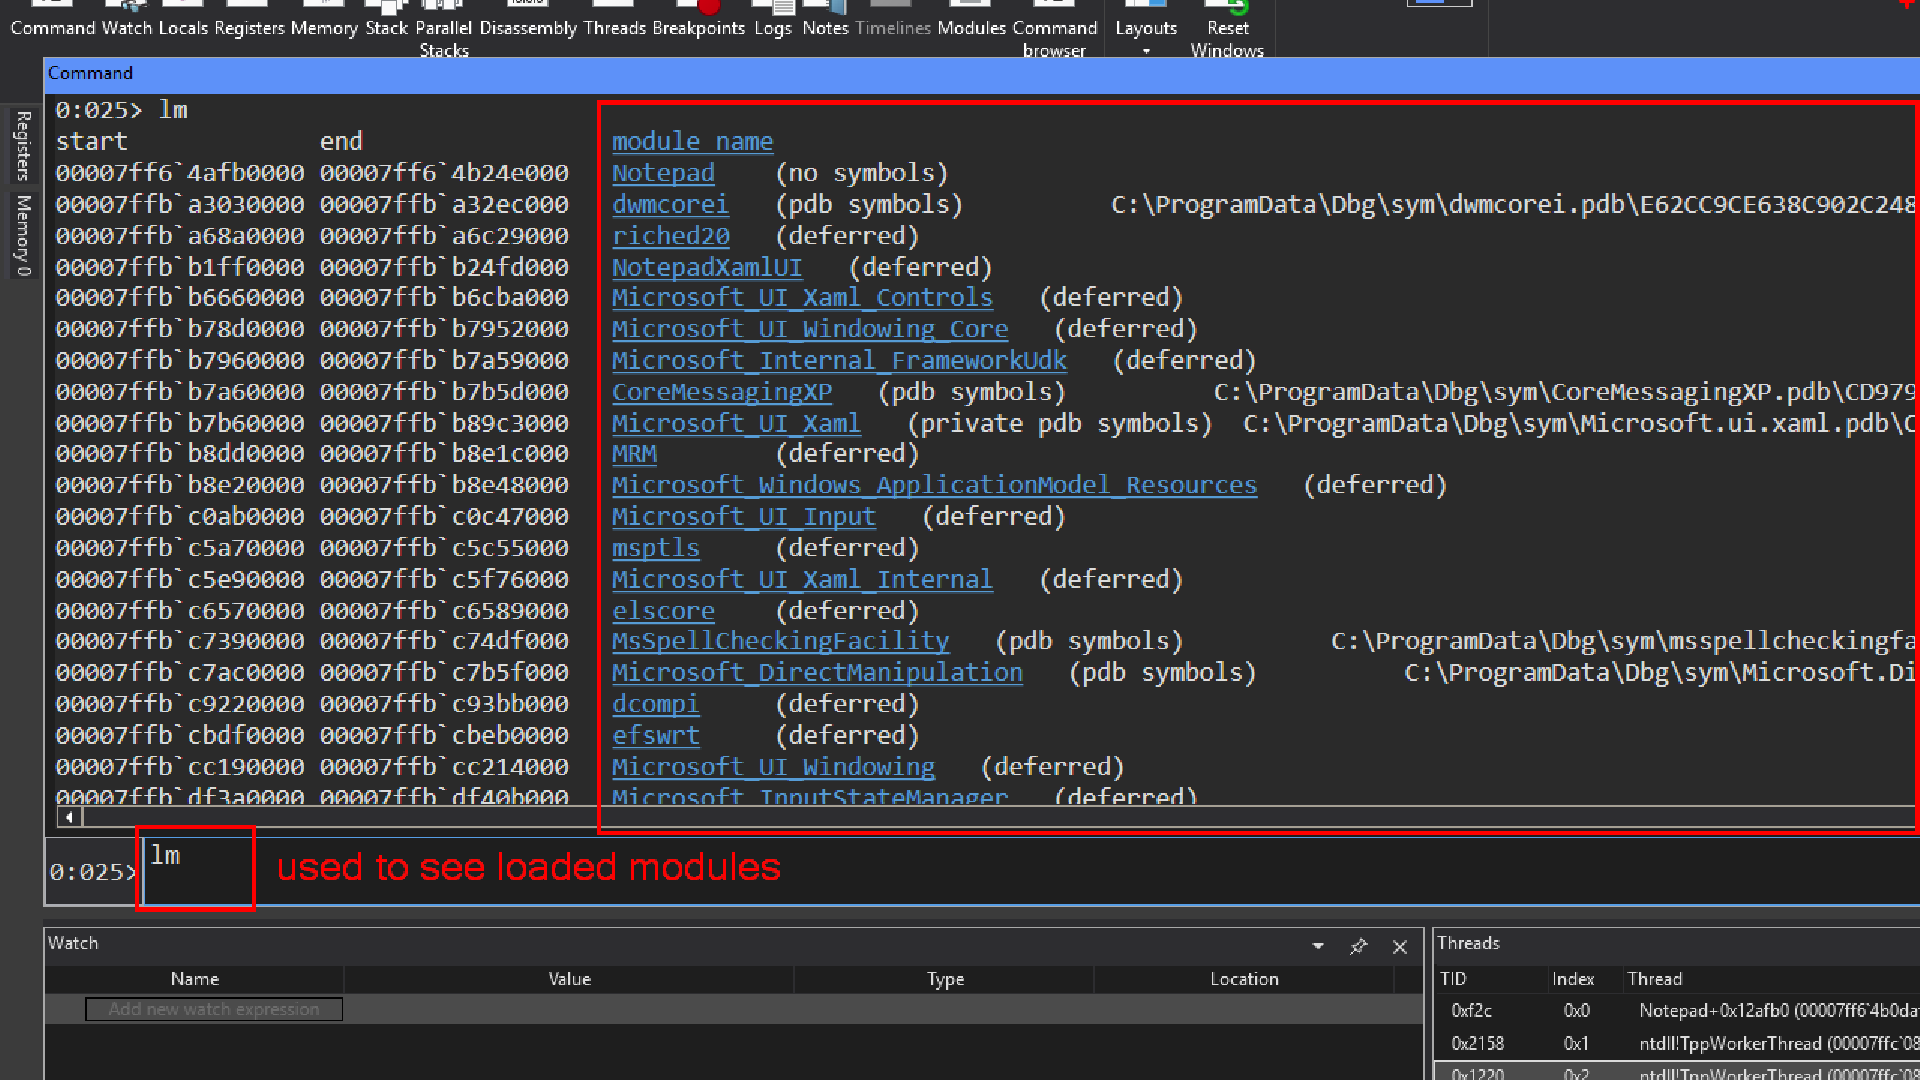
lm
stands for List Loaded Modules.
It shows you all the modules (executables, DLLs, drivers, etc.) that are loaded in the debuggee’s address space.
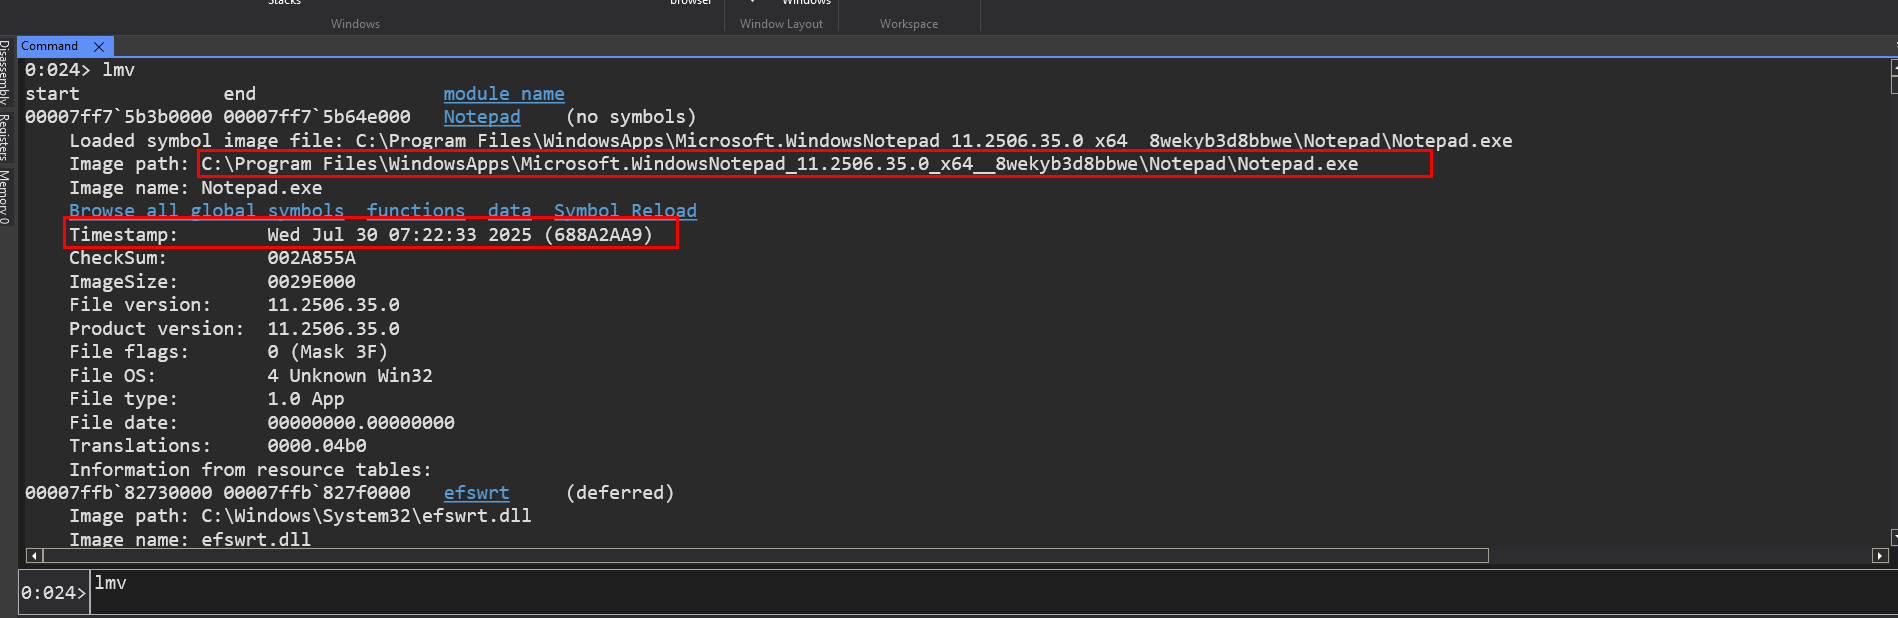
Variants of lm
-
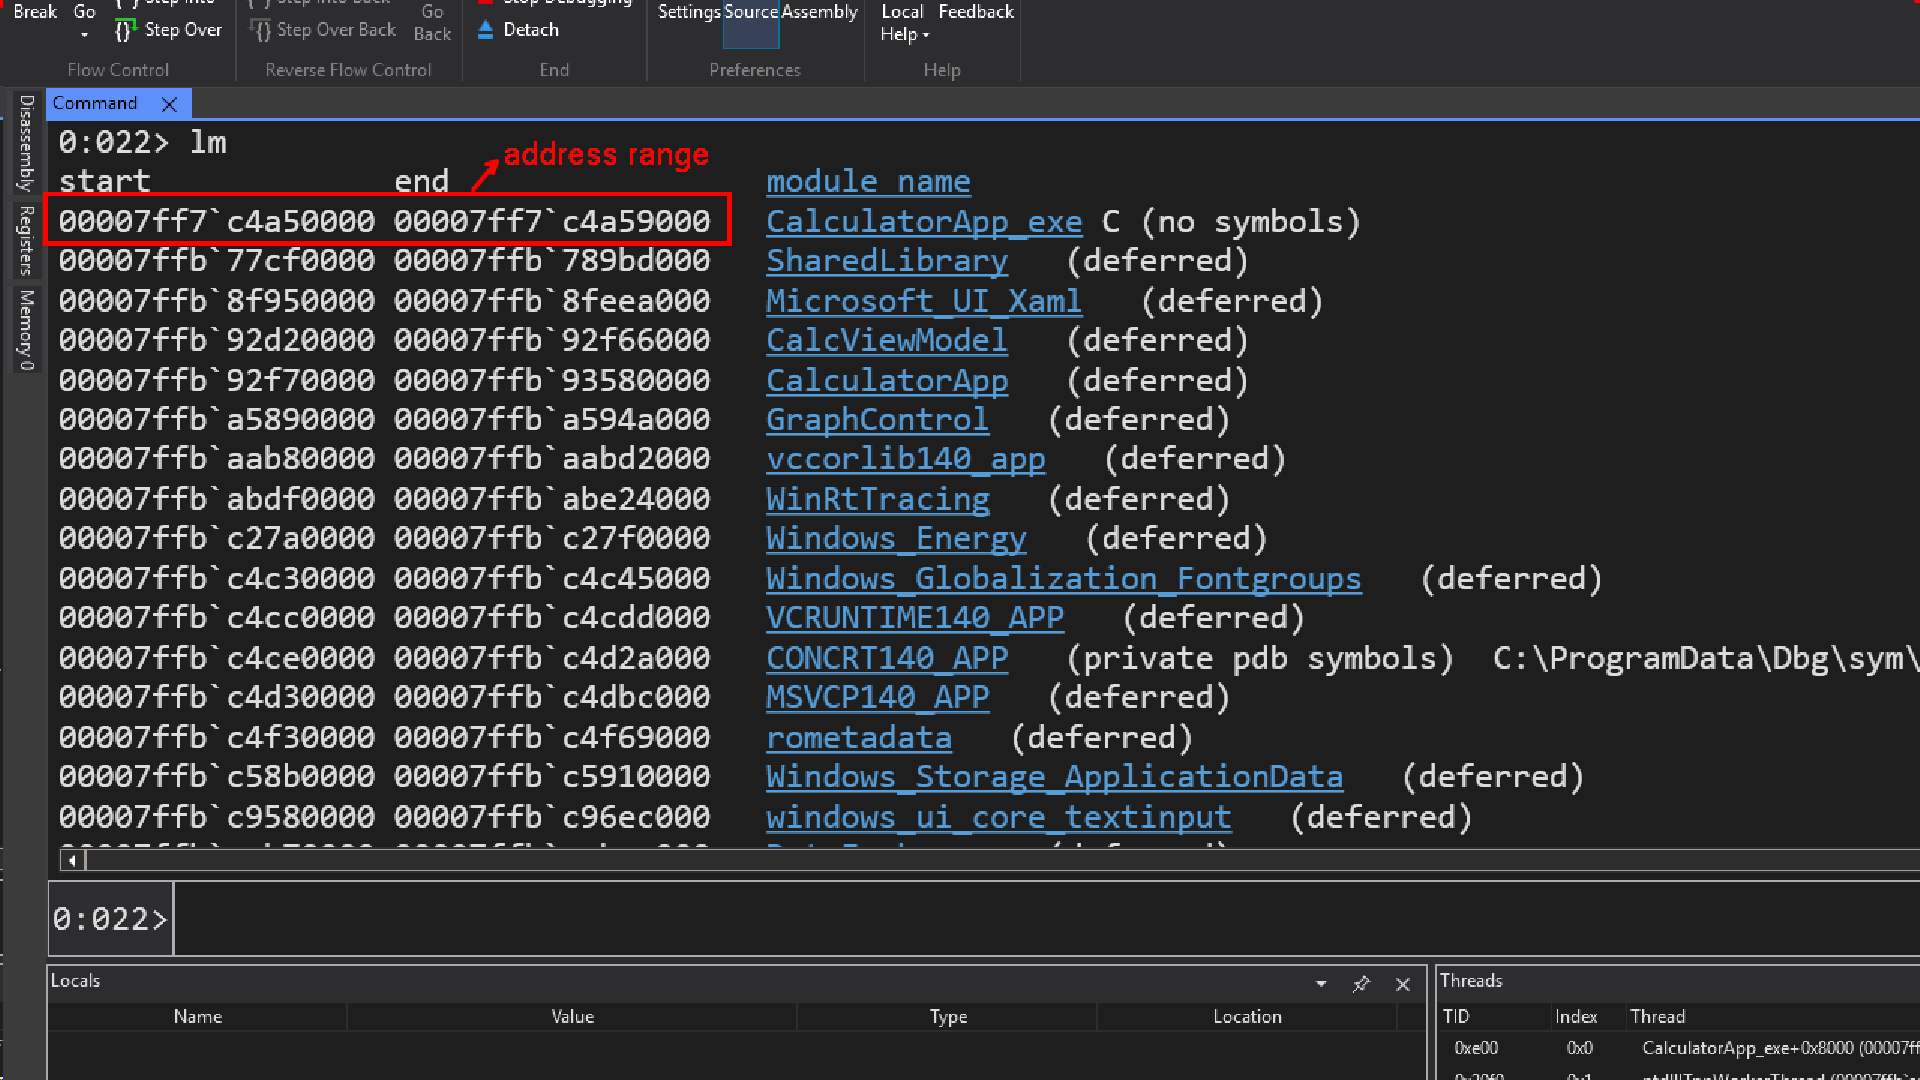
lm→ lists all modules with their base address and end address. -
lmv → verbose listing (includes timestamp, symbol status, version, company info). -
lm t n→ filter options:-
t = show timestamps -
n = show module names only
-
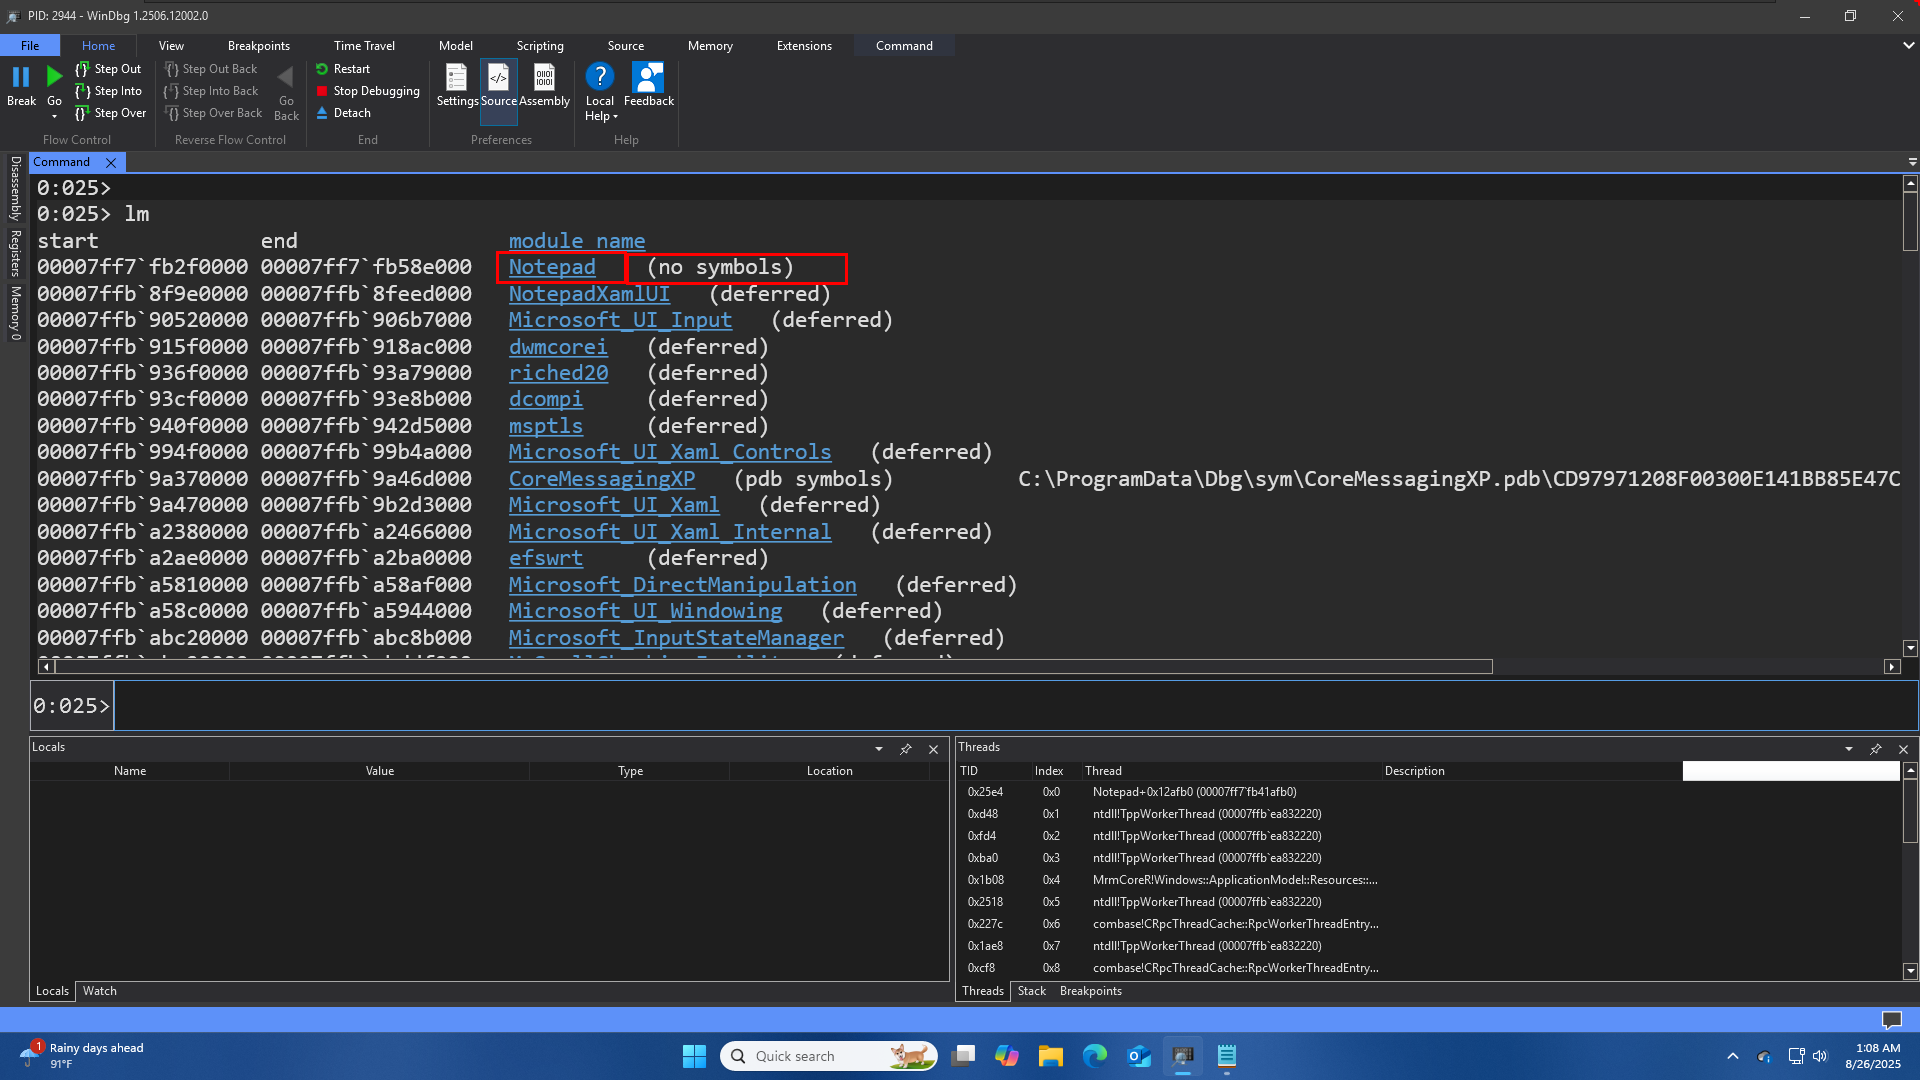
we already have symbols configured correctly still we see this no symbol on the command window, its because notepad.exe the one coming from microsoft store is not provided with symbols.
But for most other binaries, dlls in this process will have some kind of symbols.
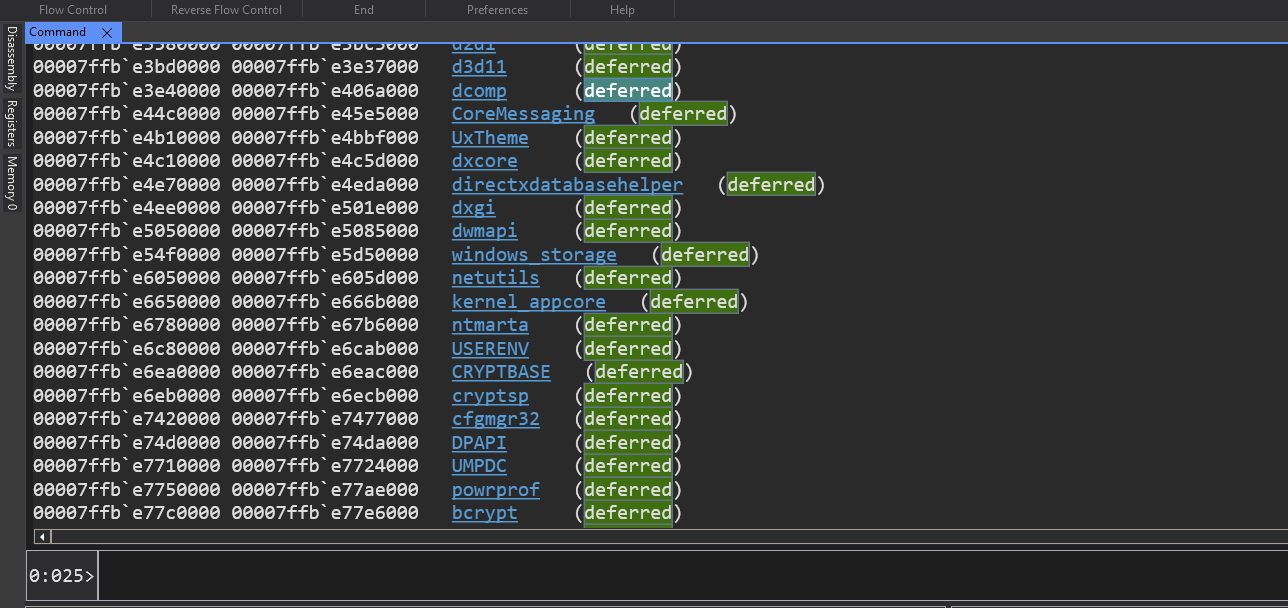
in most cases we find this value deferred, it means debugger didnt need symbols for these module if it did, then it will try to locate the symbols and then provide a different result here to the ability of the symbols.
How WinDbg Finds and Stores Symbols
When you are debugging a program, WinDbg needs symbols to make sense of the code. Symbols are like a dictionary for your program’s binary code; they contain information like function names, variable names, and line numbers. Without them, you would only see raw memory addresses, which is very difficult to understand.
When a debugger like WinDbg says it has “PDB symbols,” it means it has successfully found and loaded the symbol file for a specific module (like a DLL or an EXE). PDB stands for Program Database, which is the file format for these symbols.
The Role of Symbol Servers
Instead of needing to download and manage all these symbol files yourself, debuggers can connect to a symbol server. For example, the Microsoft Symbol Server hosts the symbol files for Windows components like ntdll.pdb. When you start a debugging session, WinDbg connects to this server and downloads only the symbol files it needs.
The Local Symbol Cache
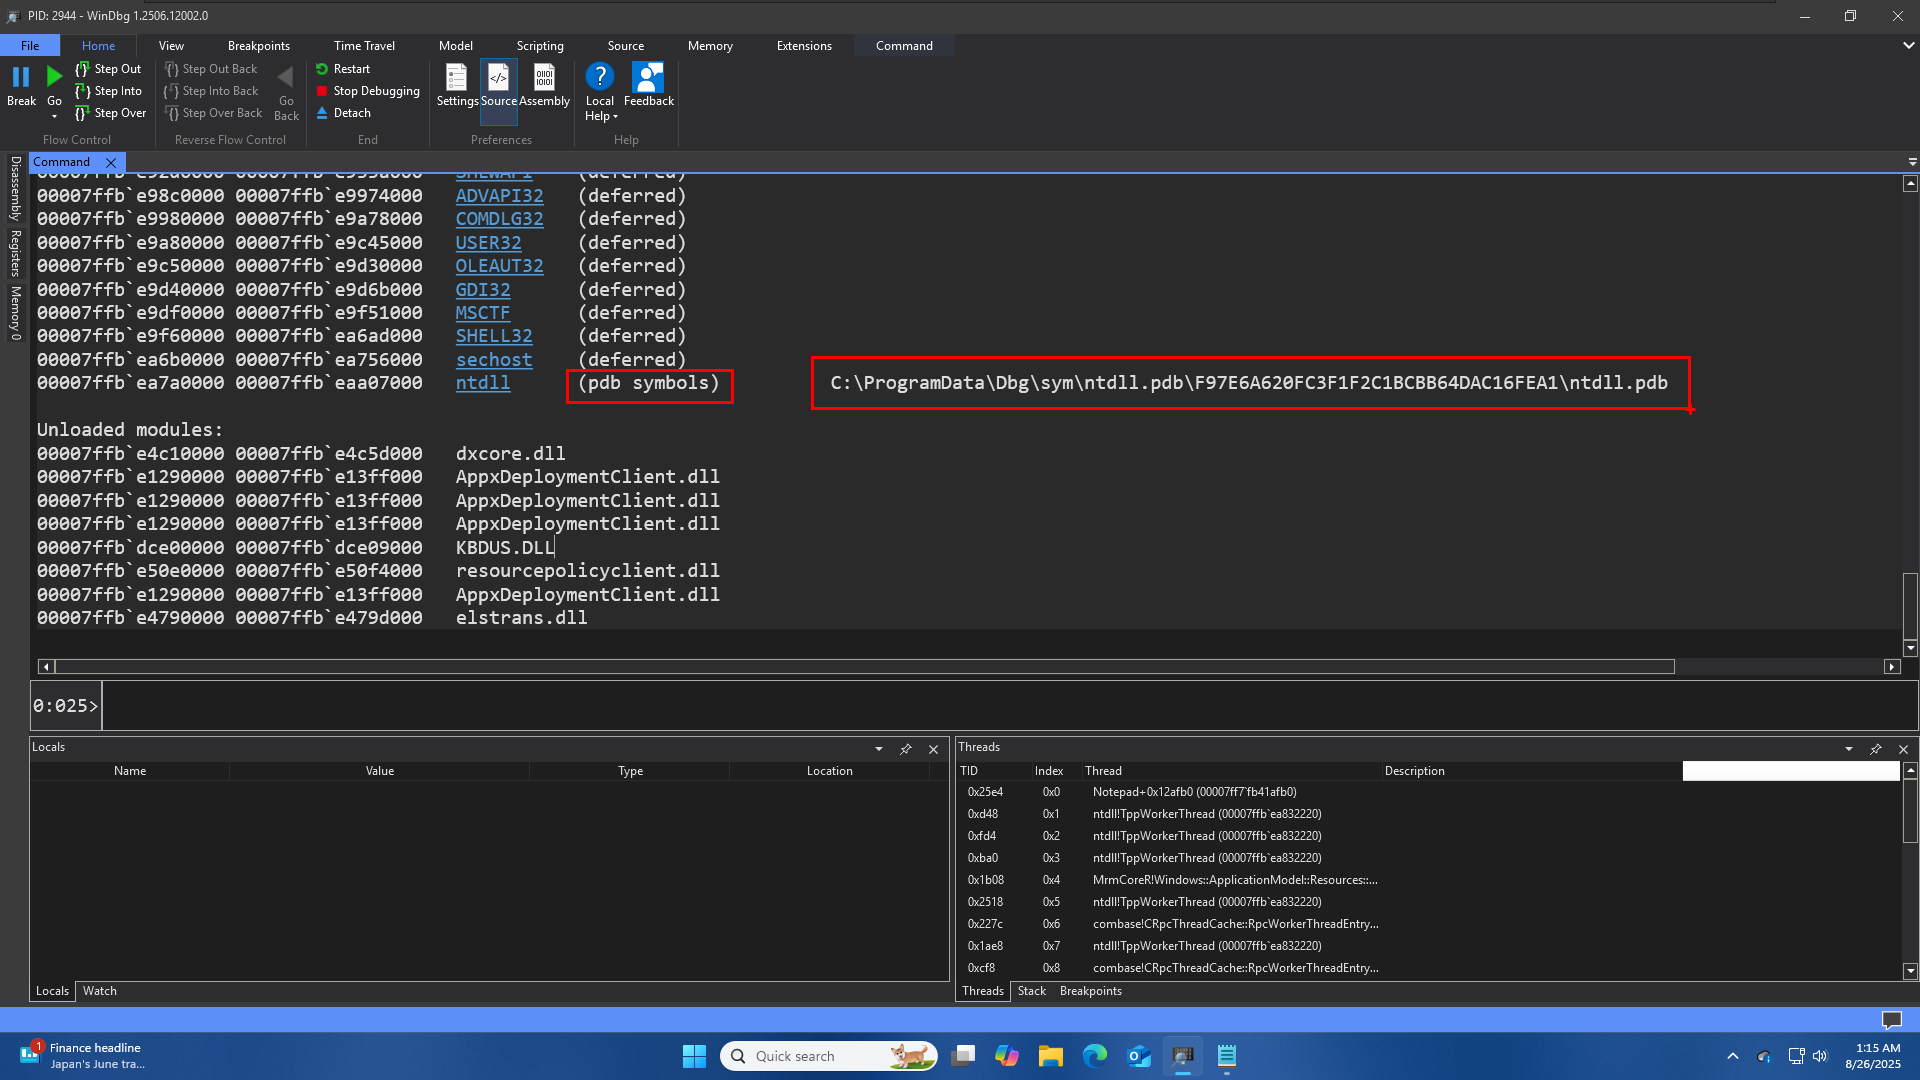
WinDbg doesn’t download these files every time. It saves them in a local folder on your computer. The image above shows an example of this local storage path:
C:\ProgramData\Dbg\sym\ntdll.pdb\F97E6A620FC3F1F2C1BCBB64DAC16FEA1\ntdll.pdb
-
C:\ProgramData\Dbg\sym: This is the default location where WinDbg stores all the symbols it downloads. It acts as a local symbol cache. -
ntdll.pdb: This is the name of the symbol file itself. -
F97E6A620FC3F1F2C1BCBB64DAC16FEA1: This long string of numbers and letters is a Globally Unique Identifier (GUID) a number which is 16 bytes in size. We can think of it as a unique fingerprint for that specific version of thentdll.pdb file. Both the binary file (e.g.,ntdll.dll) and its corresponding symbol file (ntdll.pdb) have this same GUID
Why is the GUID Important?
The GUID is crucial for ensuring that the debugger loads the correct symbol file for the binary you’re debugging. A file name alone isn’t enough, because:
- Different versions of a DLL (e.g., from a Windows update) might have the same file name (
ntdll.dll) but are completely different internally. - If you debug multiple machines with different versions of the same file, using only the filename would mix up the symbol files.
By using the GUID, WinDbg can ensure that the symbol file it loads exactly matches the version of the binary it is currently examining. The GUID is also used to create a unique sub directory in the local symbol cache, preventing different versions of the same symbol file from overwriting each other. This makes the local cache reliable, even if you are debugging multiple systems with different software versions.
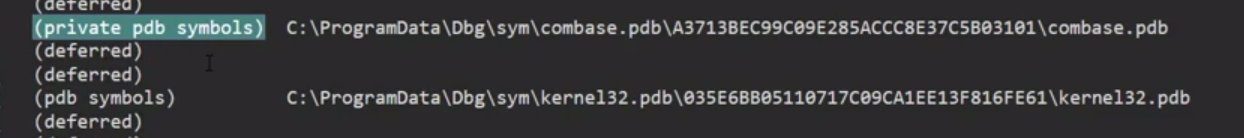
In some rare cases we can also get Private pdb symbols this is unlikely to happen for microsoft binaries except for COM base, COM is provided with private symbols, we still dont have access to source code but we still have the extra information in the symbols, and not sure if that is provided intentionally with private symbols or by accidently.
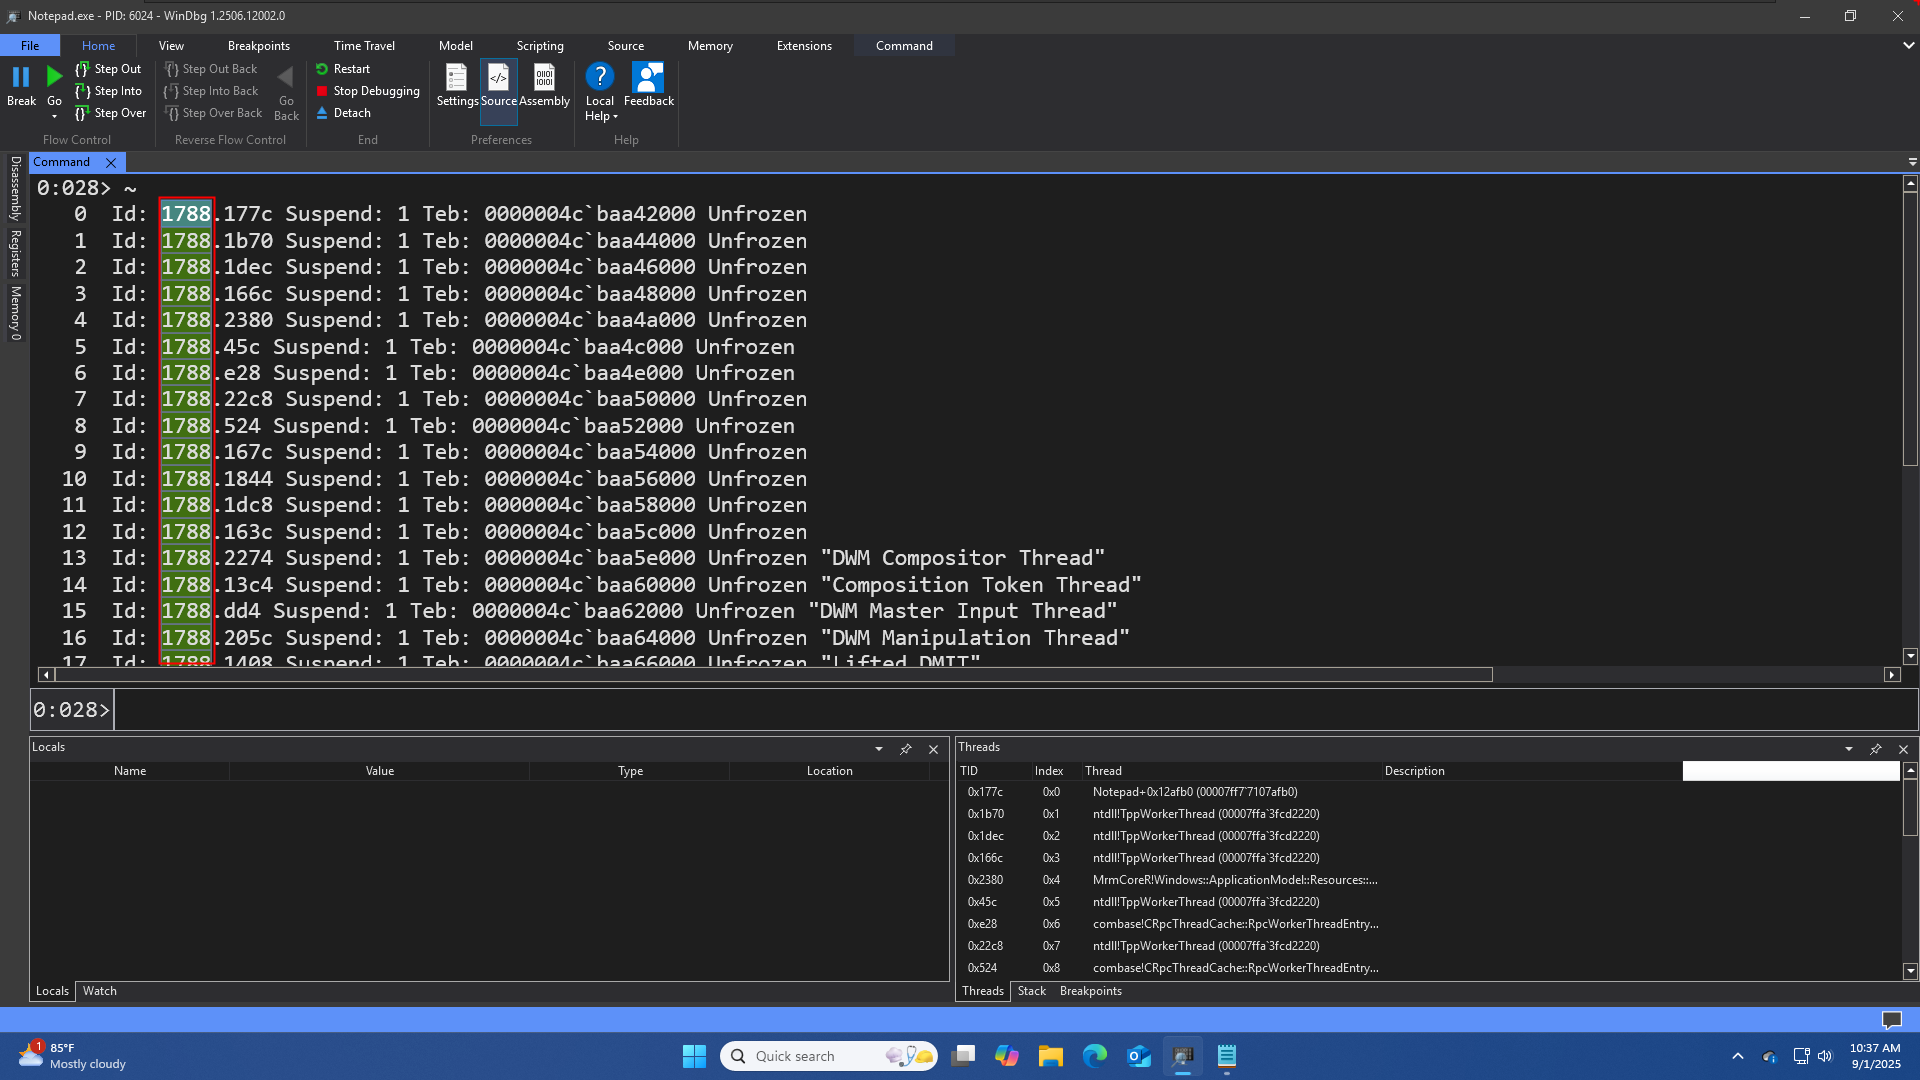
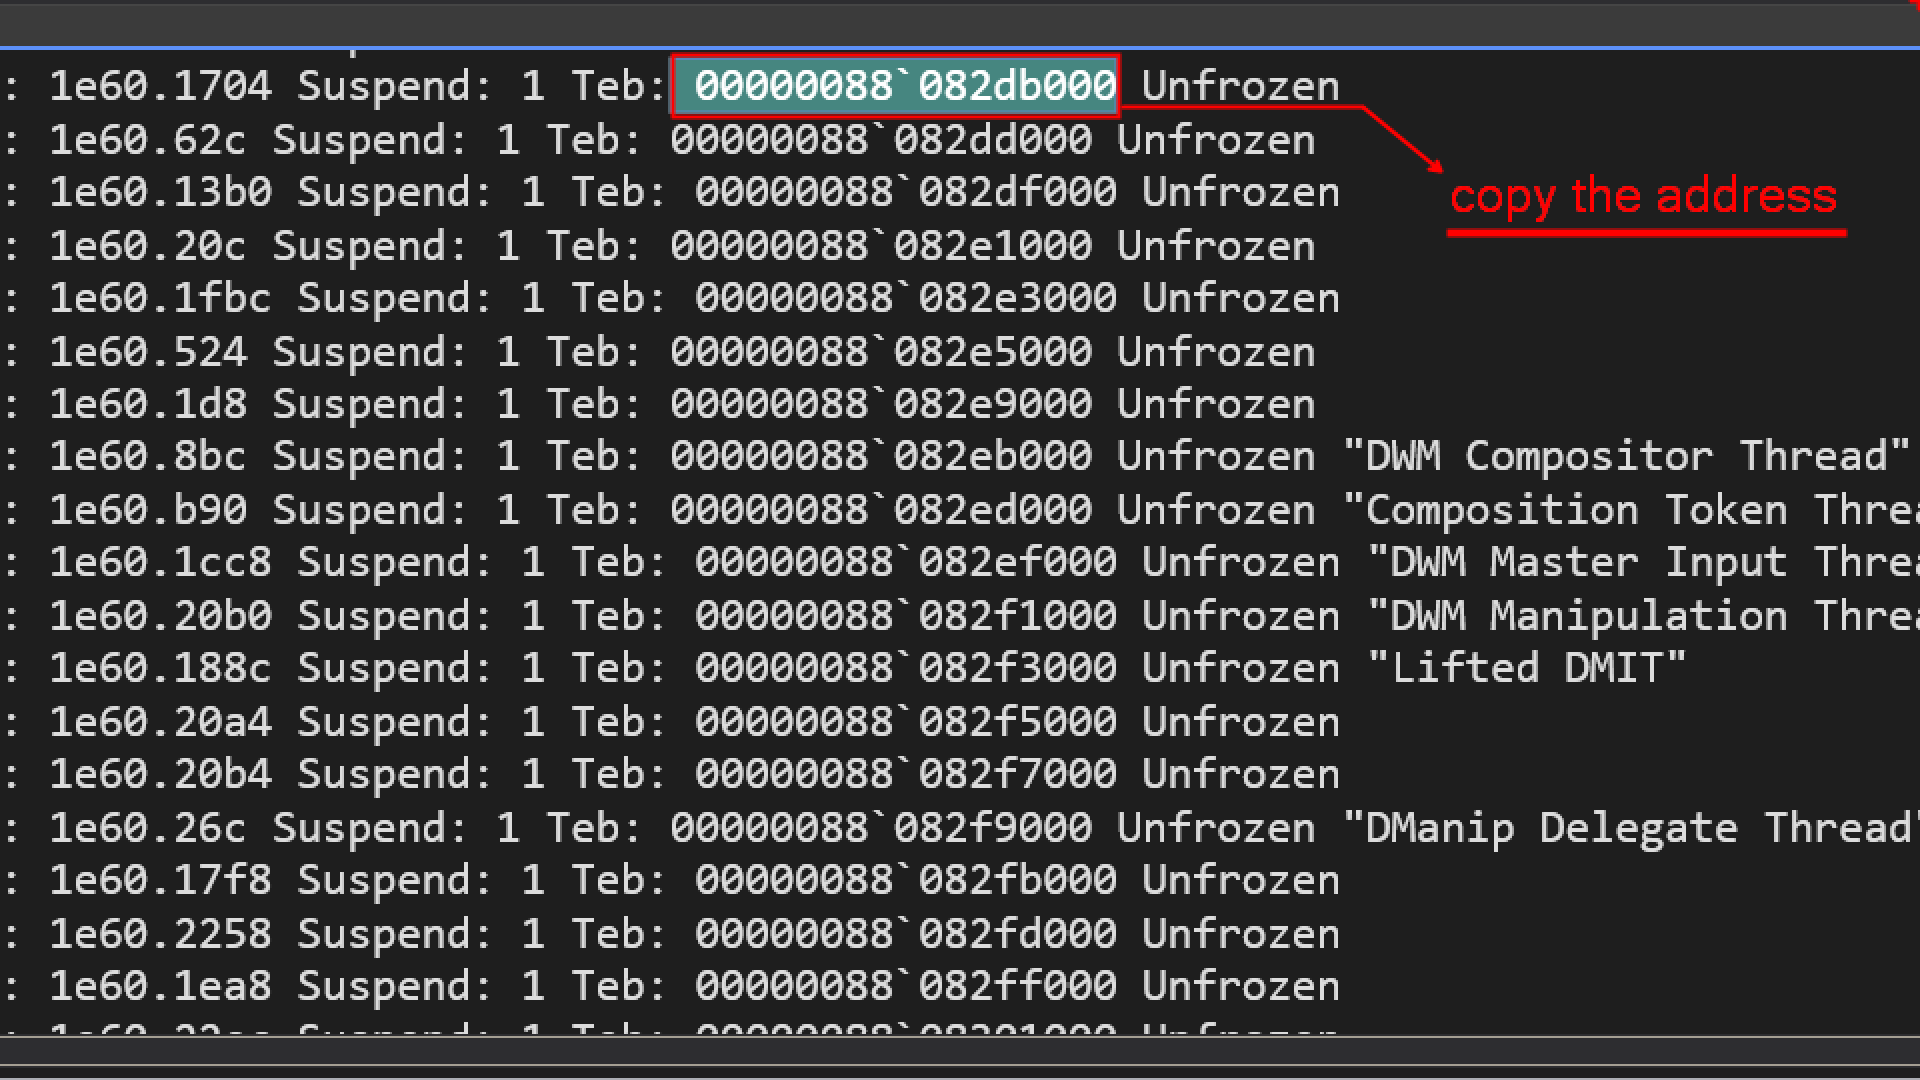
In WinDbg, the tilde (~) symbol is a key component of commands related to threads. ~ is a command to display the status of all threads in the current process.
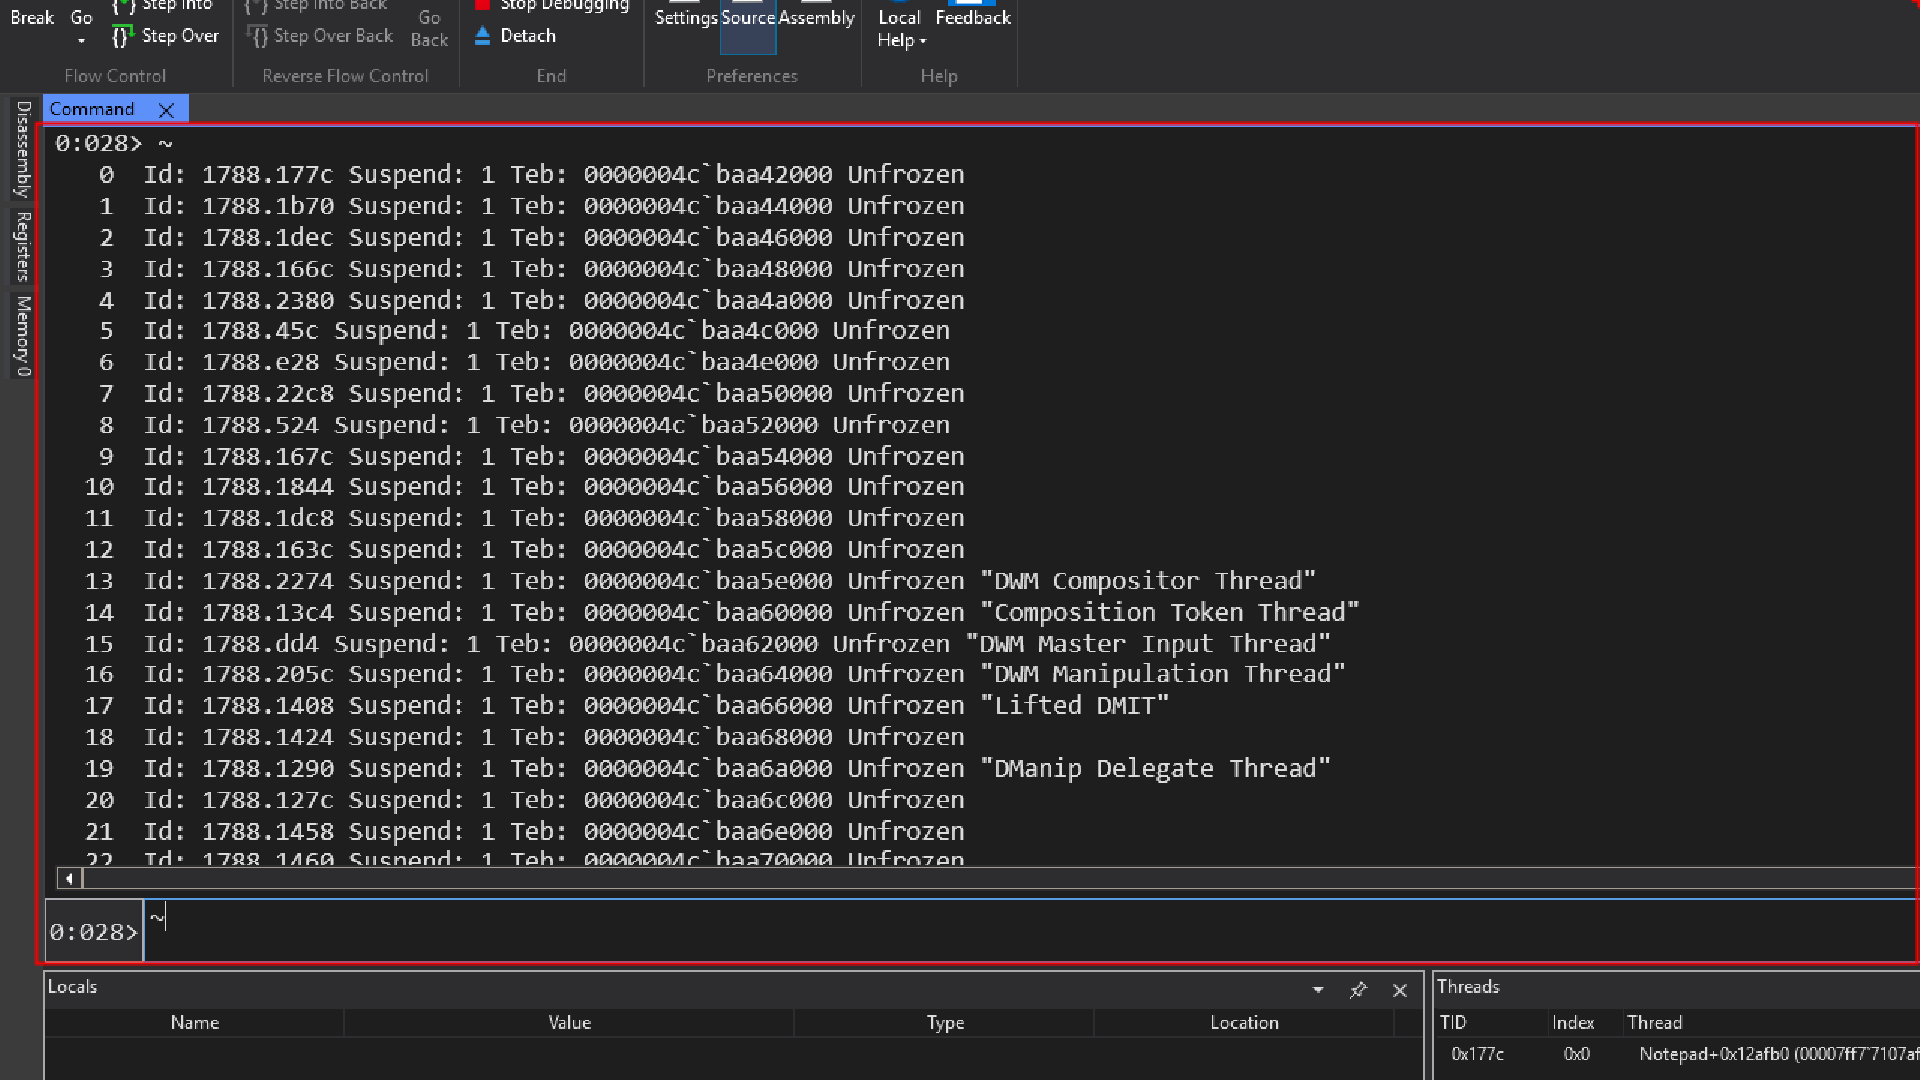
Let’s try to understand the output
0 Id: 1788.177c Suspend: 1 Teb: 0000004c`baa42000 Unfrozen
0: This is the Index number(internal index used by windbg to represent that thread) for the thread listing. anytime we want to invoke some command that is thread related, we might need first switch the appropriate thread before invoking that command.
Id: 1788.177c: This is the thread ID (sometimes refered to as client ID). It’s presented in the format ProcessID.ThreadID.
-
1788: The hexadecimal ID of the process this thread belongs to.
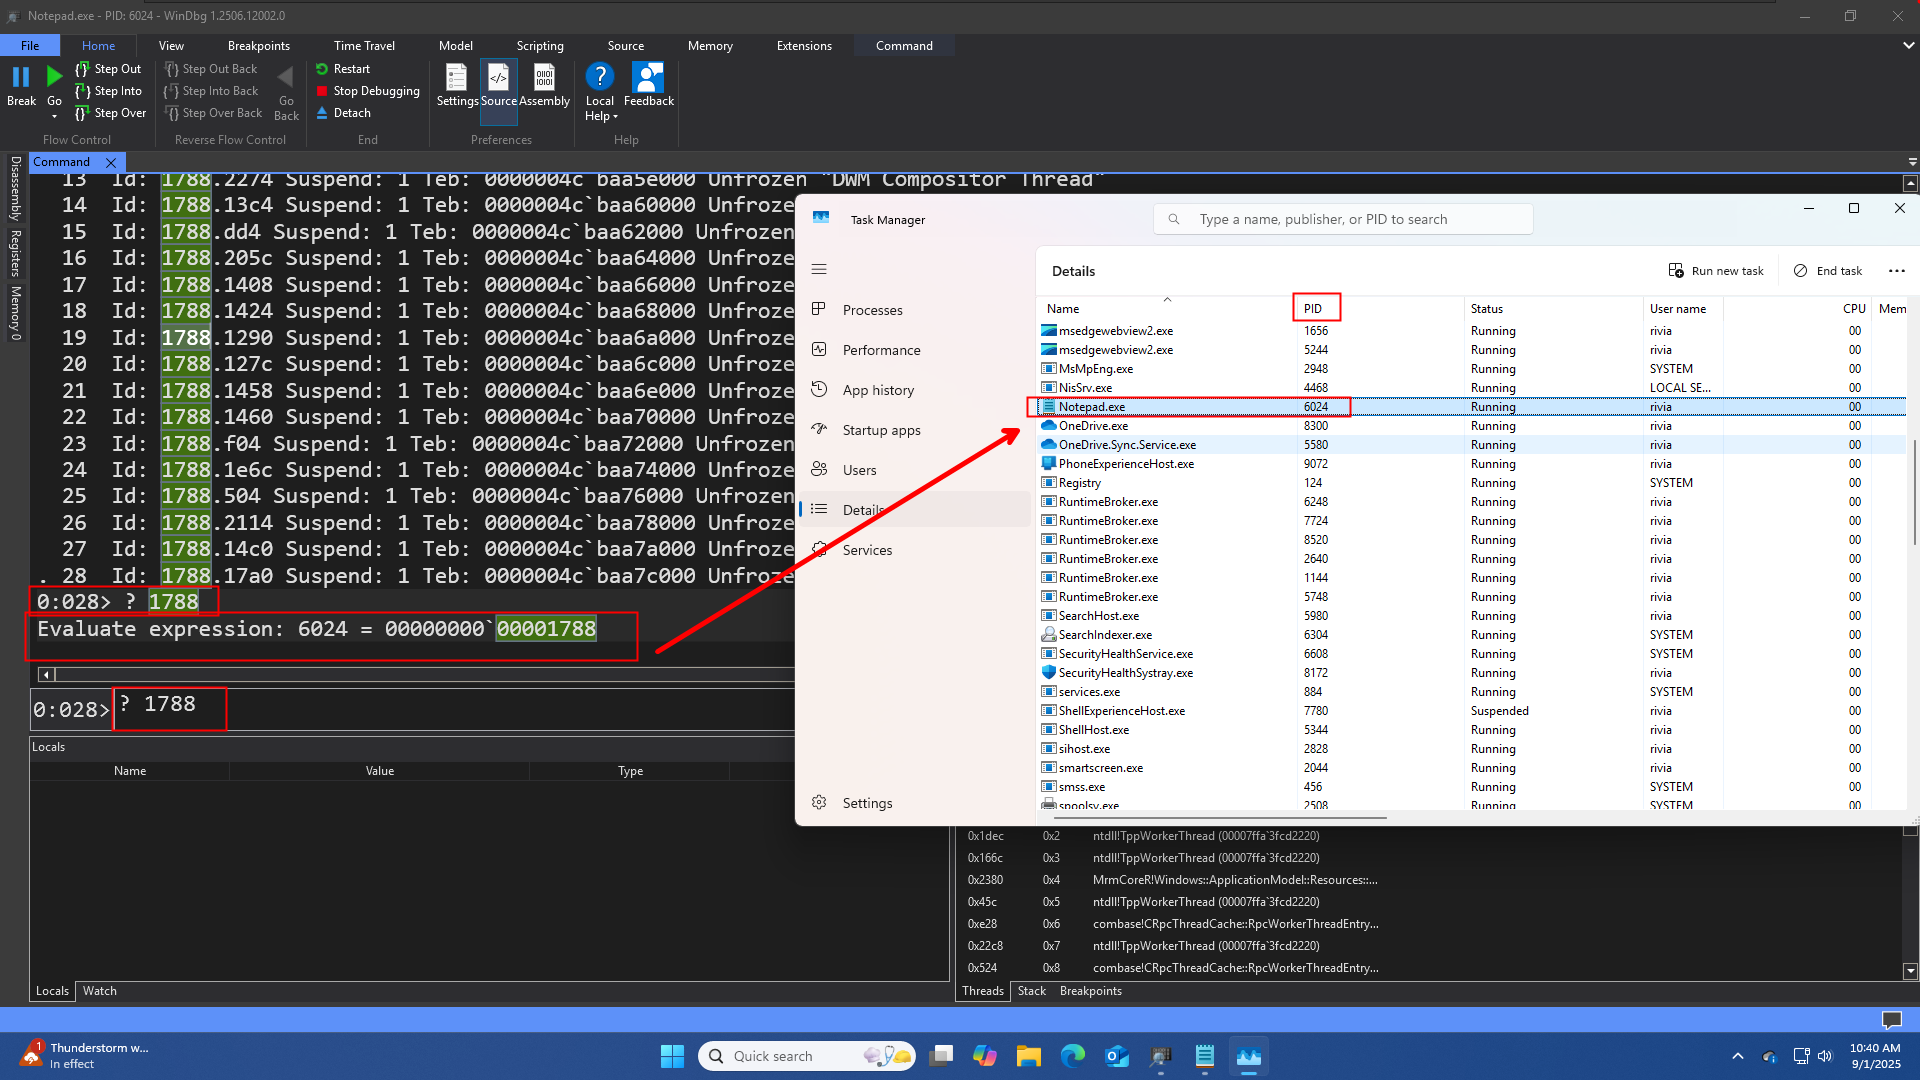
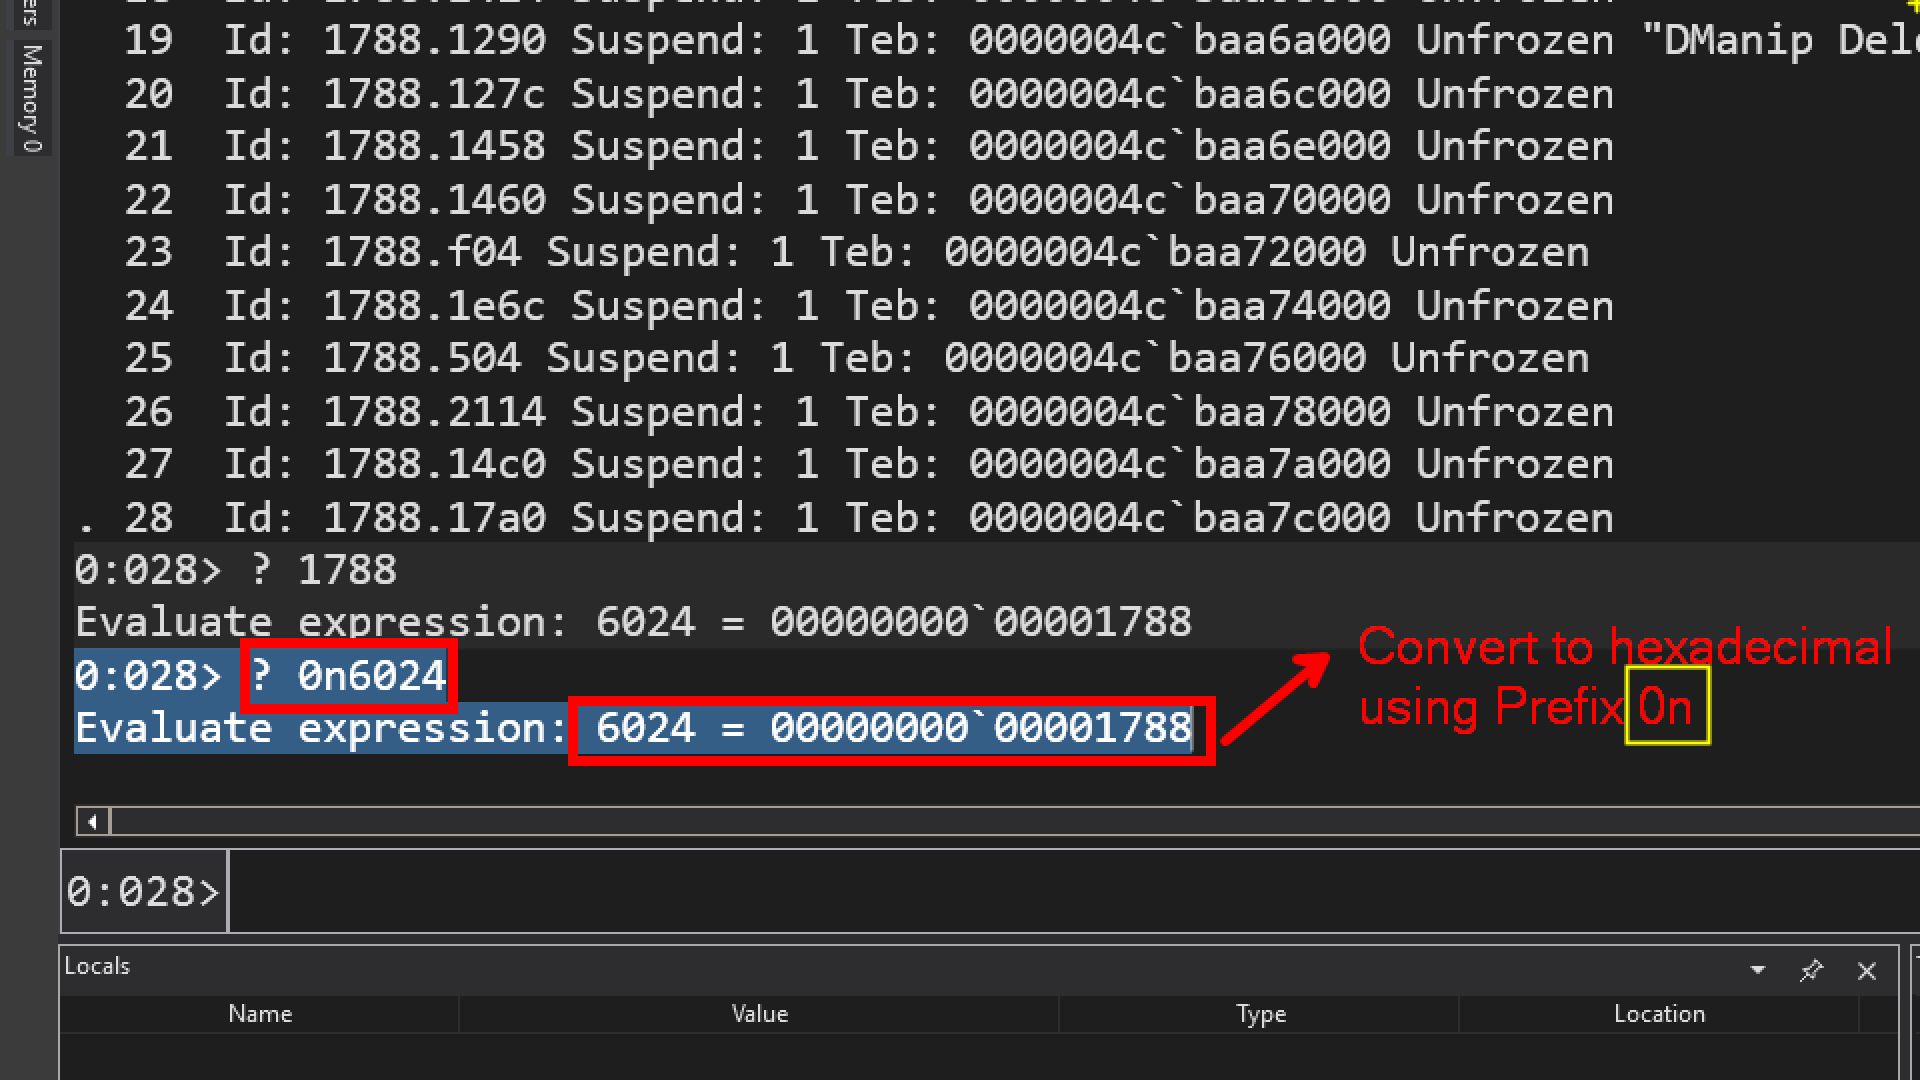
By default most of the values shown by Windbg is in Hexadecimal Format. The question mark ( ? ) command is used to convert the hexadecimal value into decimal.
Prefix to use Decimal is 0n
-
177c: The unique hexadecimal ID of the thread itself.
Suspend: 1: This indicates the thread’s suspension count. A value of 1 means the thread has been suspended once. If the count were 0, the thread would be running normally.
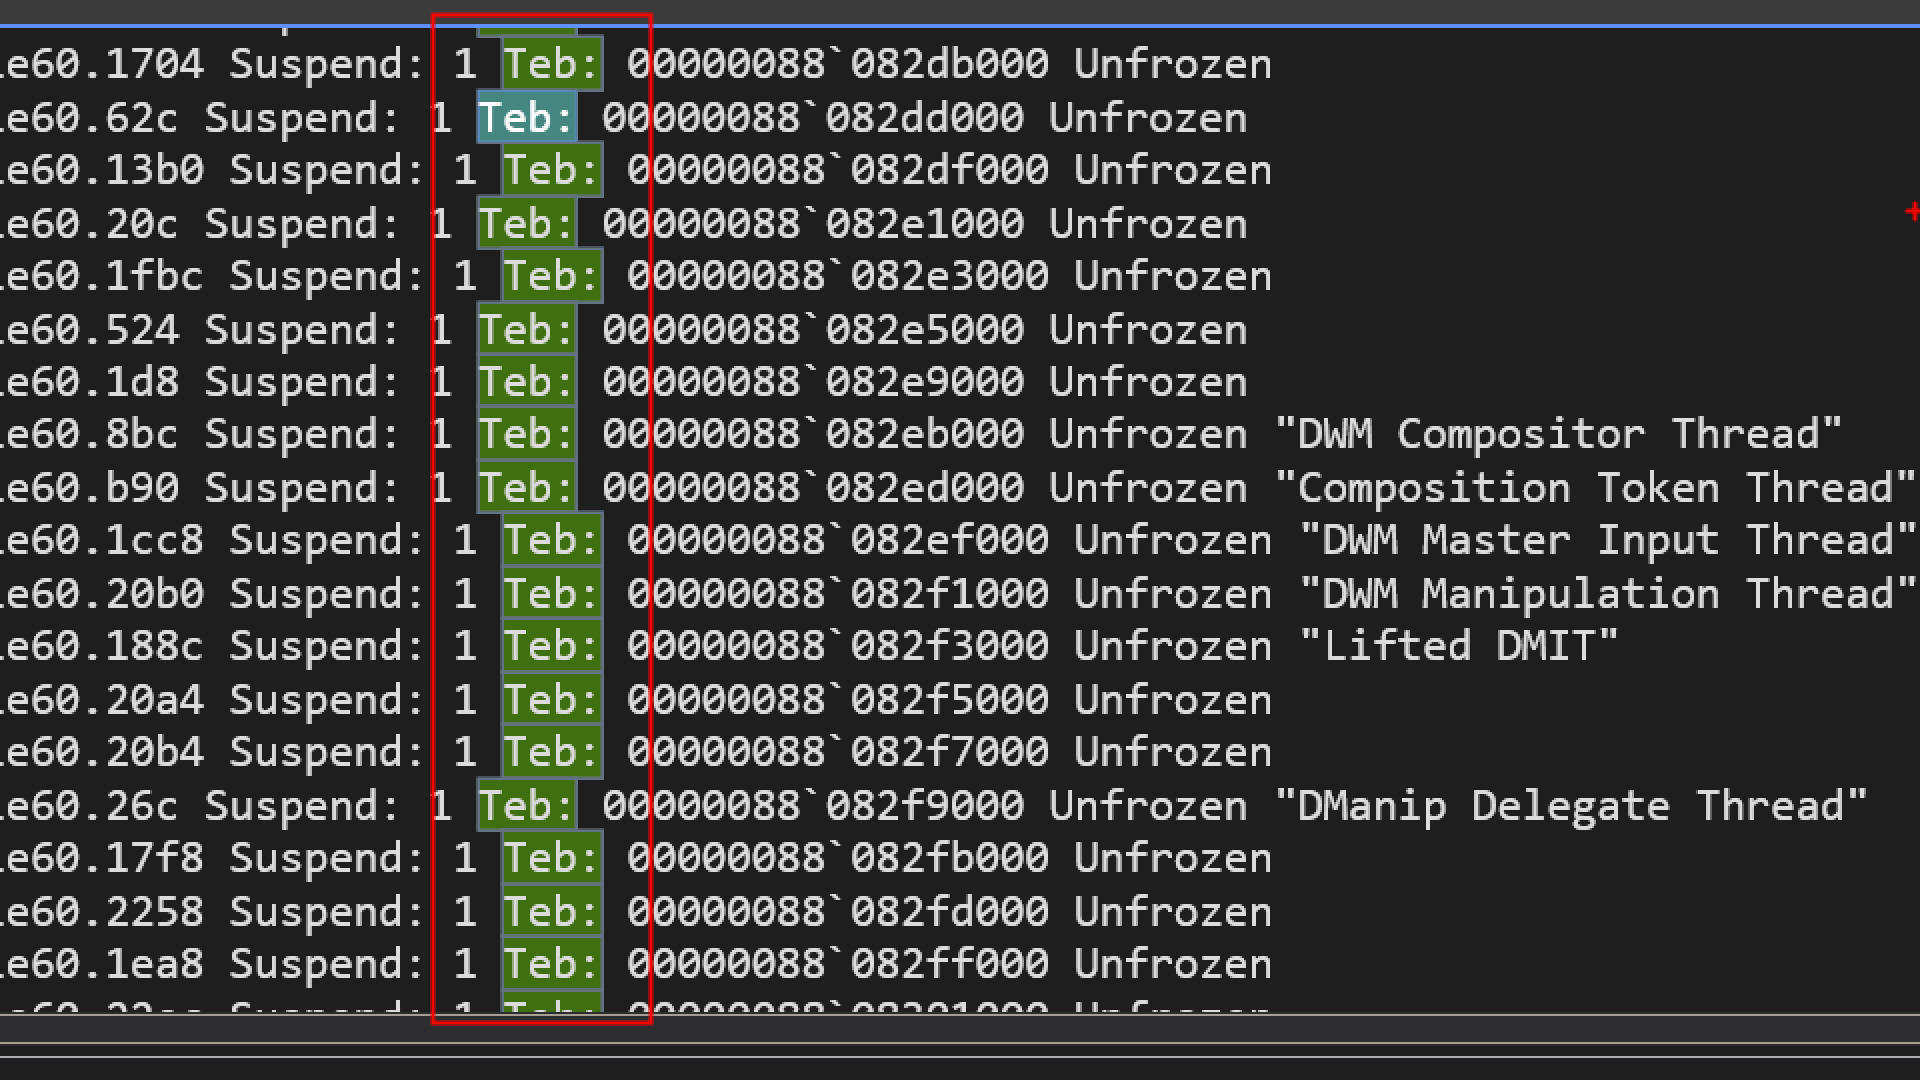
Teb: 0000004c`baa42000 Unfrozen
This is the memory address of the Thread Environment Block (TEB) . The TEB is a crucial data structure that holds all the information about the thread, including its stack, thread local storage, and exception handling information.
The backtick( ` ) is used to separate the high and low 32-bit halves of the 64-bit address.
Unfrozen: This is a state flag. It tells you that the thread is not “frozen” by the debugger. A thread that is Unfrozen is ready to run, though it may still be suspended (Suspend: 1), waiting for a signal, or actively executing code.
TEB(Thread Environment Block)
TEB is a data structure in userspace containing some information which is on a thread by thread basis, so how can we gain more details about the thread environment block ?
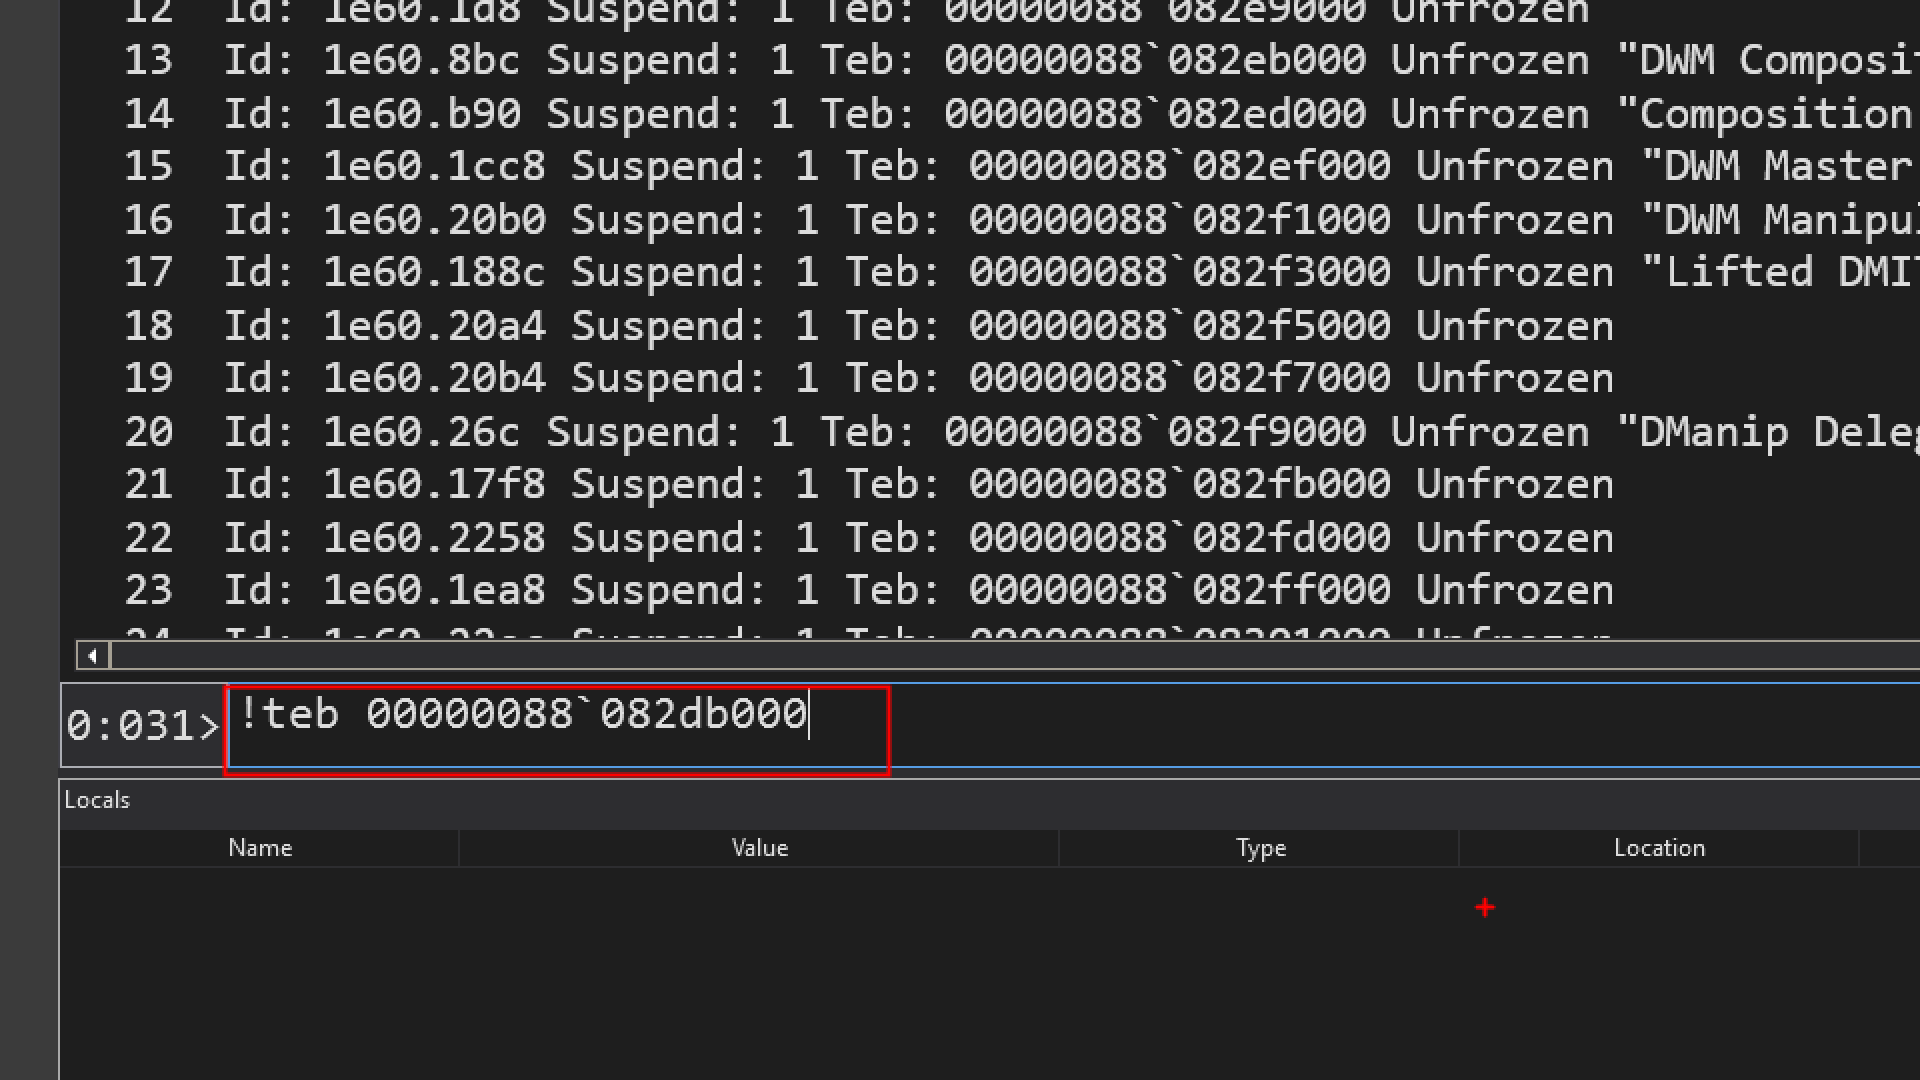
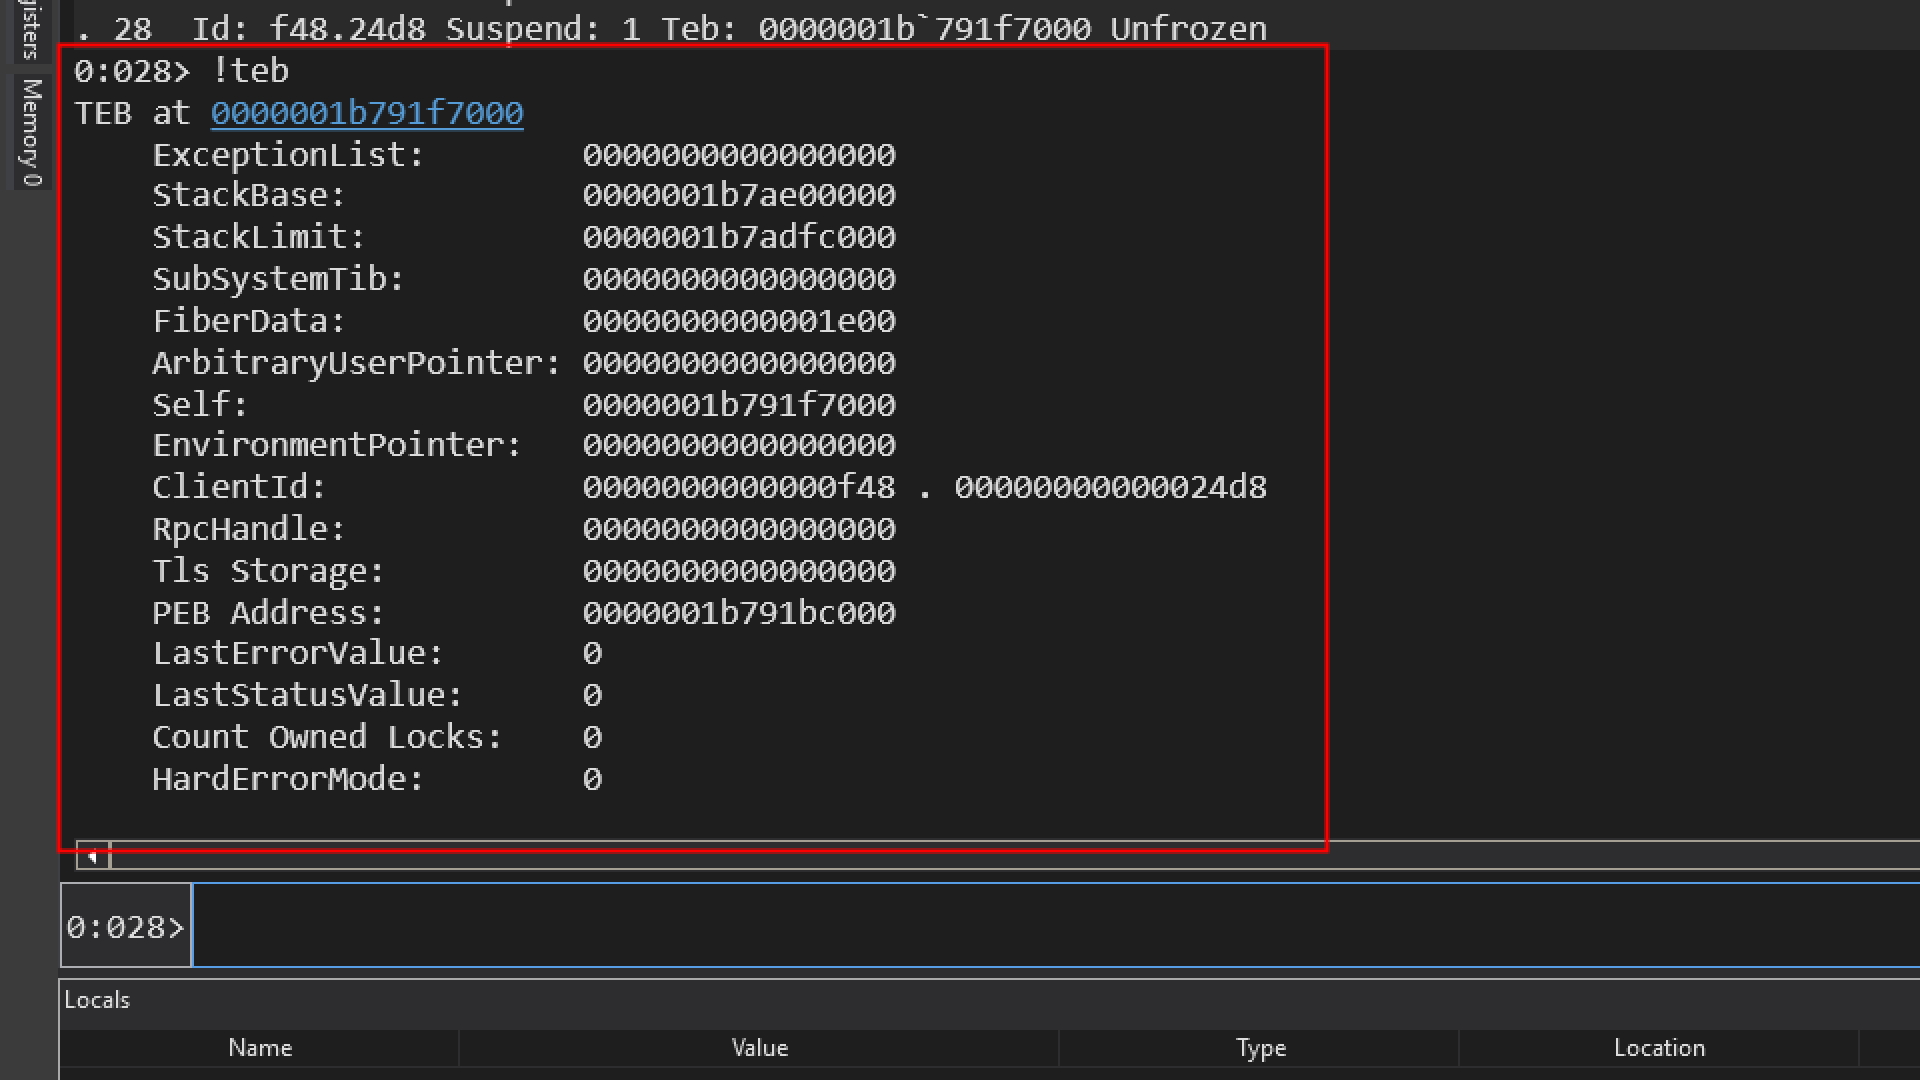
!teb <address>
The teb data structure is not documented officially, but many of its fields are reversed engineered.
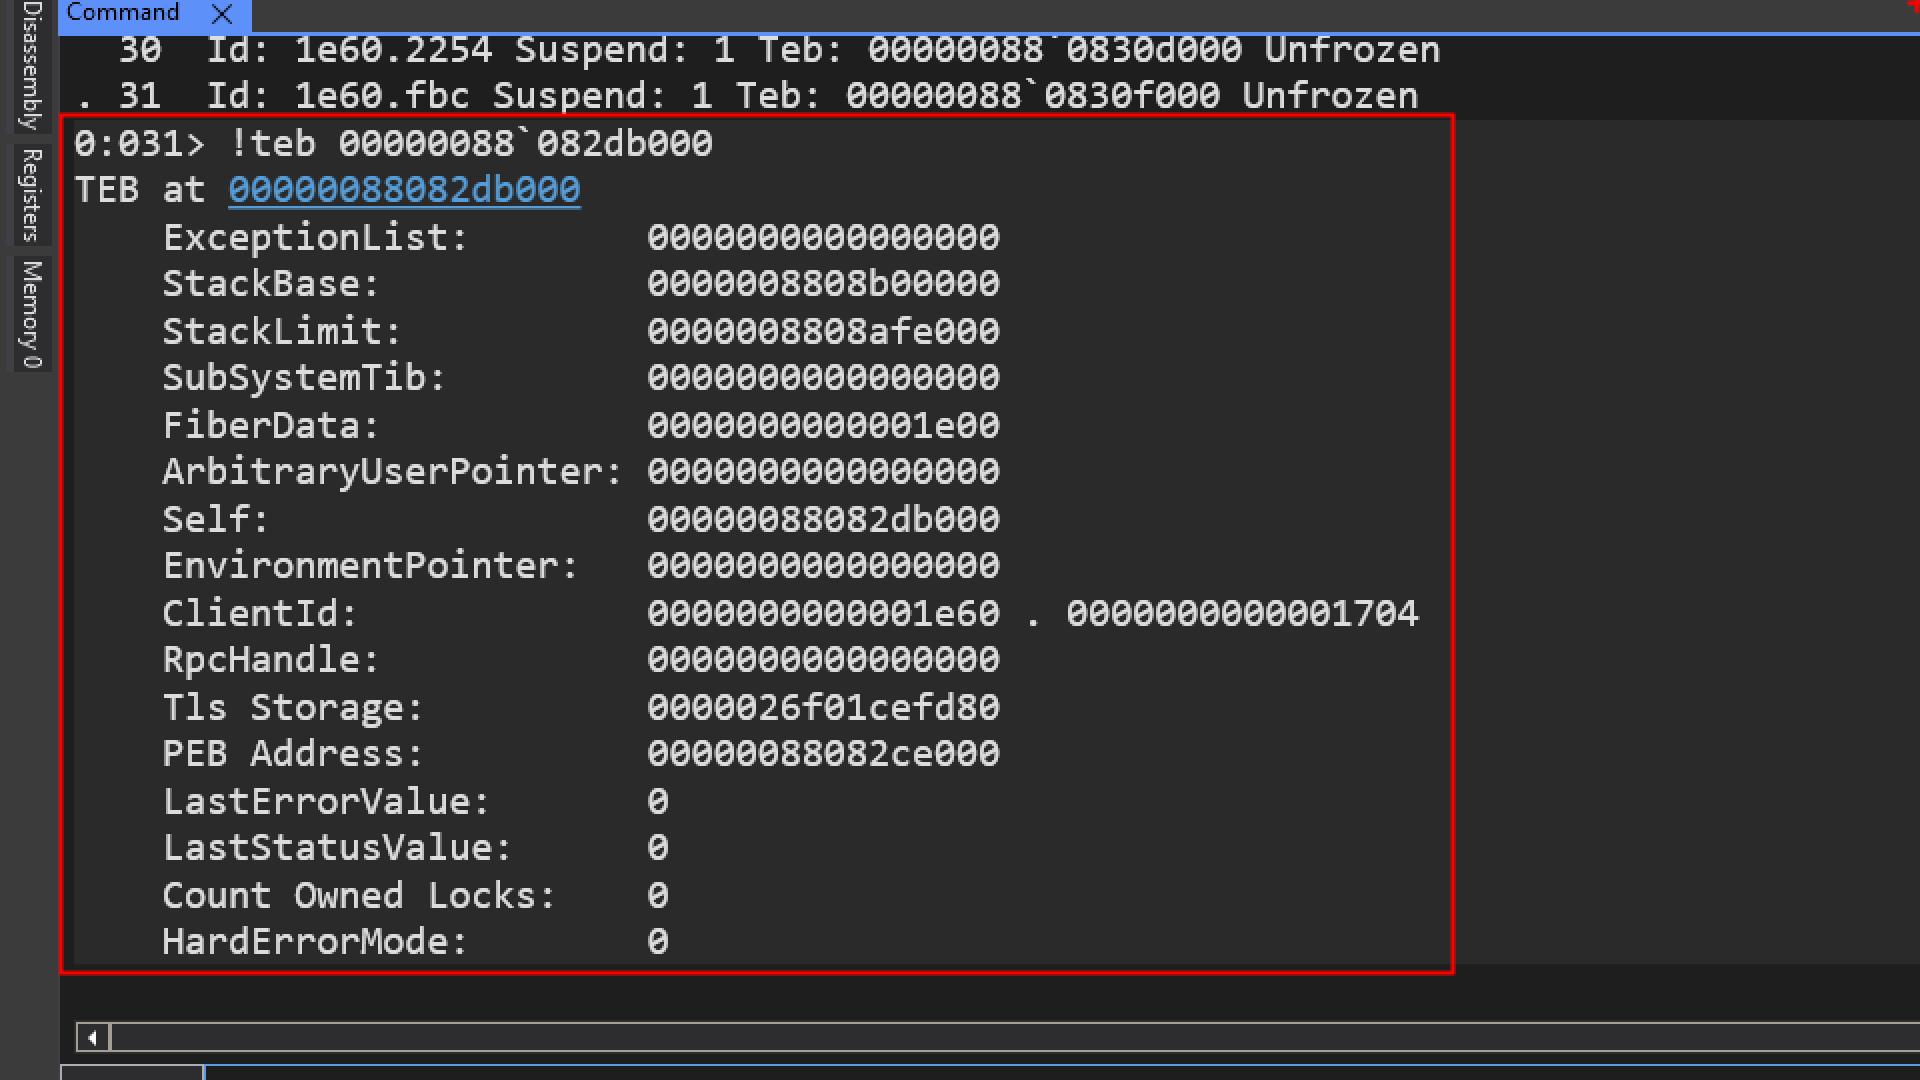
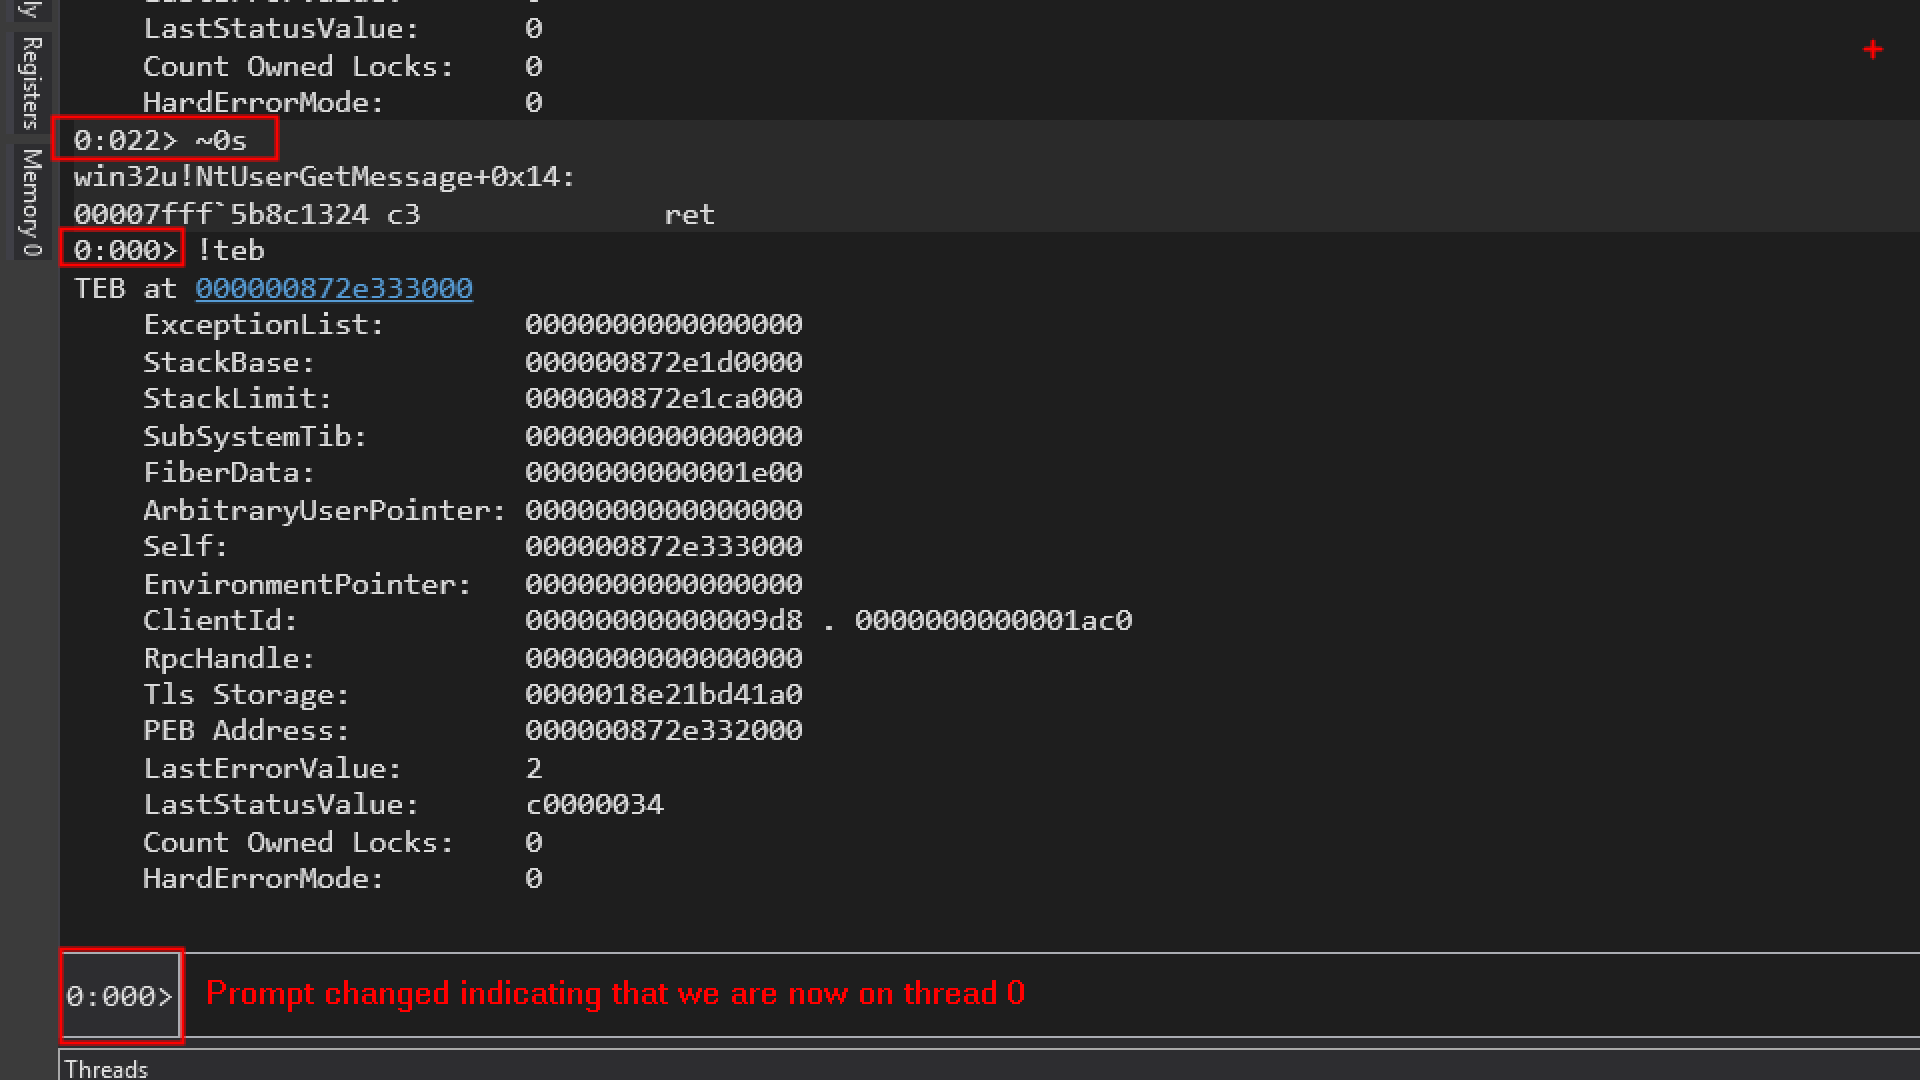
Interpreting the TEB Output
- ExceptionList:
0000000000000000 indicates there are no structured exception handlers. - StackBase: 0000008808b00000 is the starting address of the stack.
- StackLimit: 0000008808afe000 is the ending address of the stack.
- Self:
00007ff7d1c51000` is a pointer to the TEB itself.
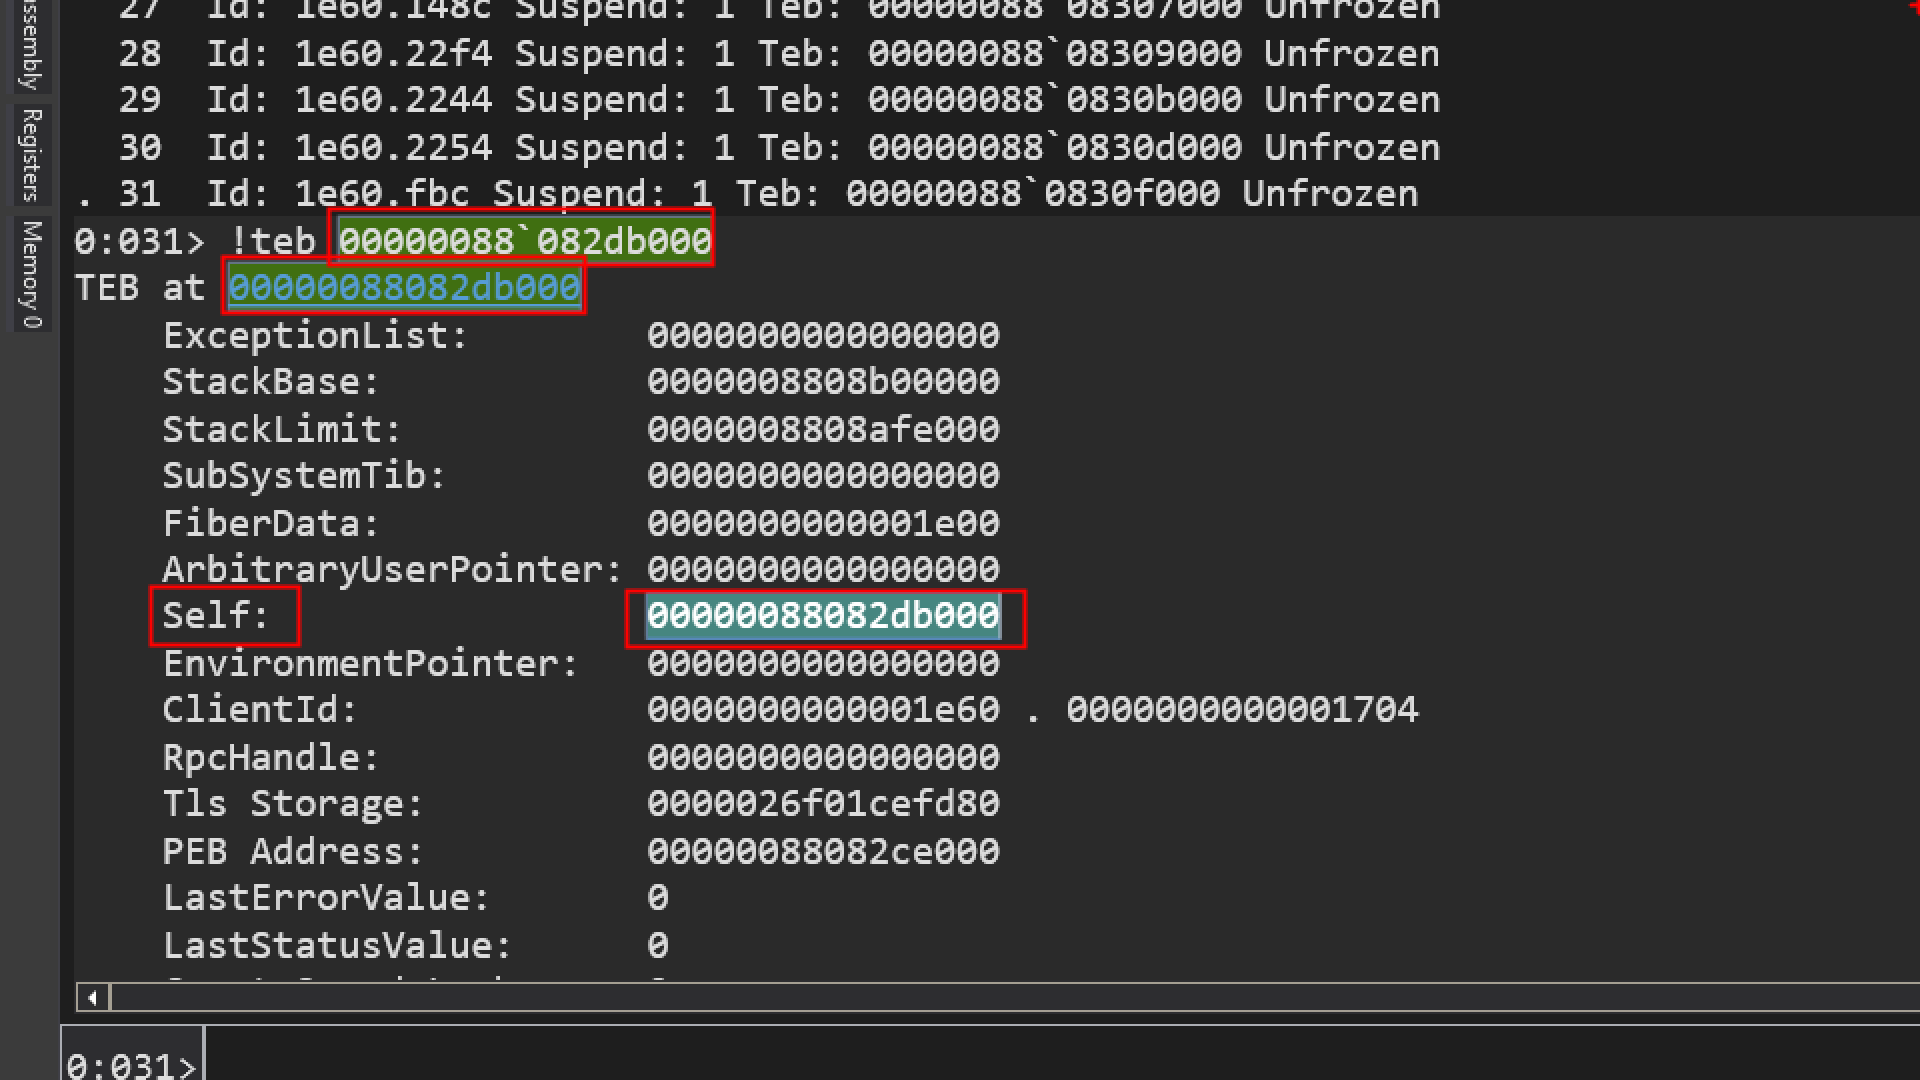
- ClientId: 0000000000001e60(Process ID) . 0000000000001704 (Thread ID).
- PEB Address: 00000088082ce000 is the address of the Process Environment Block.
- Tls Storage: The
Tls Storage field inside the TEB points to the memory structure that holds the actual array of thread local storage slots for that thread. 0000026f01cefd80

dt _teb or dt _TEB
dt command is short for display type, infact this is one of the commands from the display family of commands.
Data structures in windows are defined in a very particular way, most data structures are defined in the following way, lets take an example of a teb data structure
typdef struct _TEB {

//..

} TEB;
This is how most data structures in windows in user space and kernel space are defined, which means that the real data structure name is _TEB and not TEB.
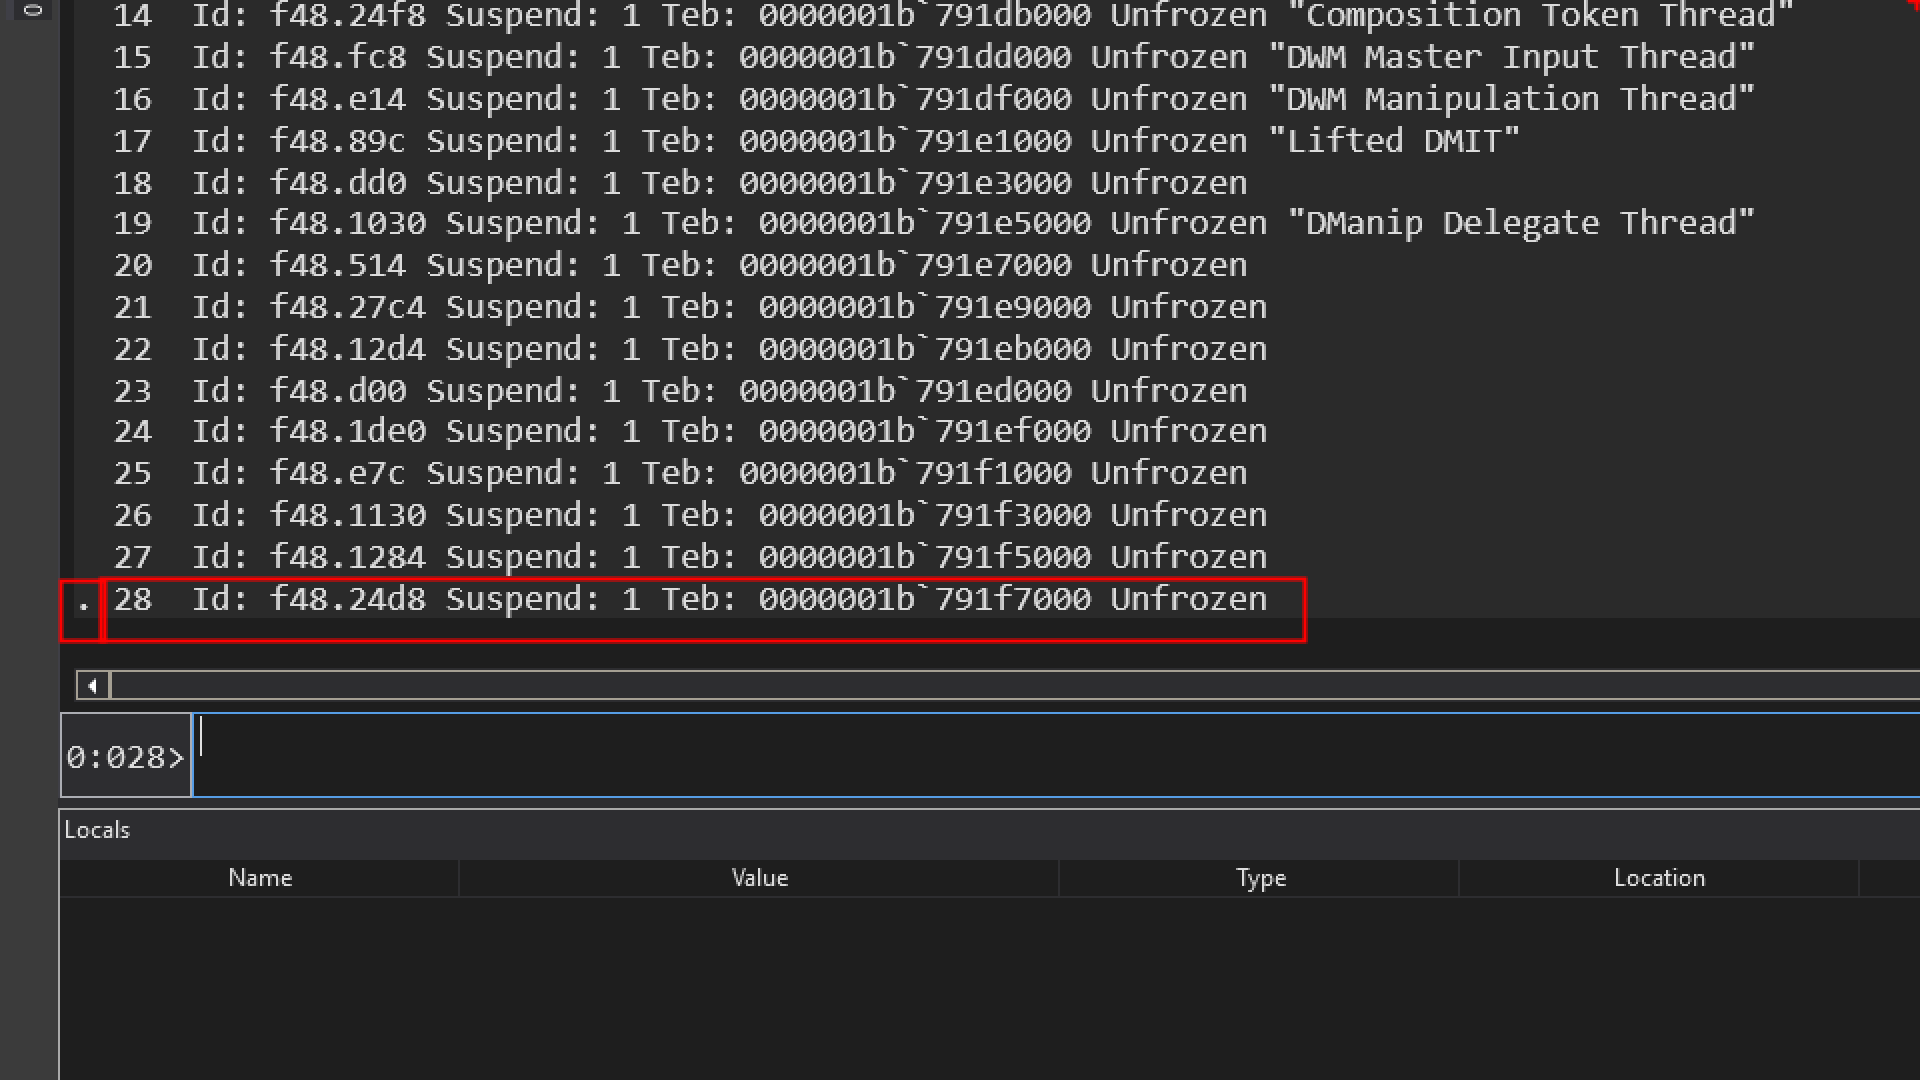
one of the things which we can notice in the thread listing is this dot. which represents the current thread so any command that we provide that is thread related, is going to use this thread unless we specify something else.
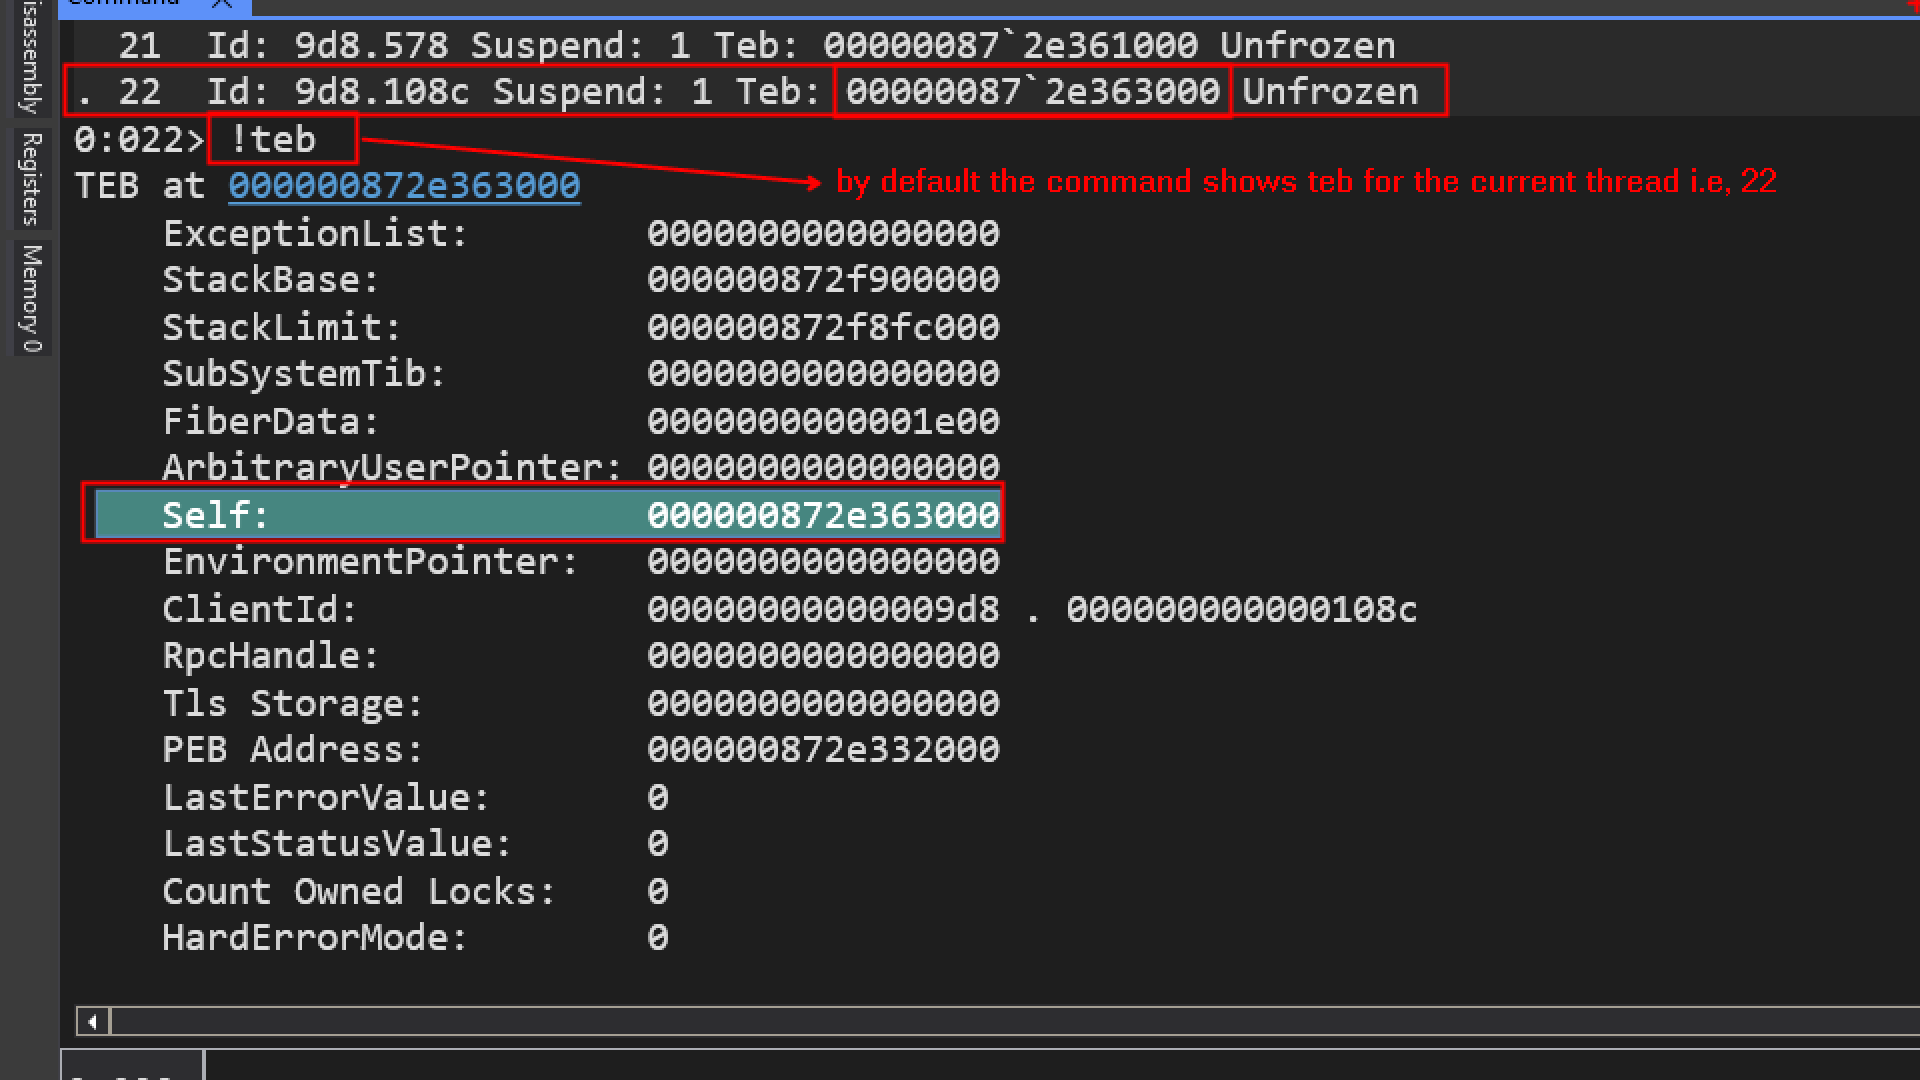
if we specify teb without any parameters
it will show me teb for thread number 28 which is the current thread which is also shown on the prompt [0:028>], 028 means the current thread. The 0 on the left of colon(:) indicates, current process index we are debugging and we are debugging just one process that index is always going to be zero, but its possible to attach to another process or launch another process while we are on the session of debugging.
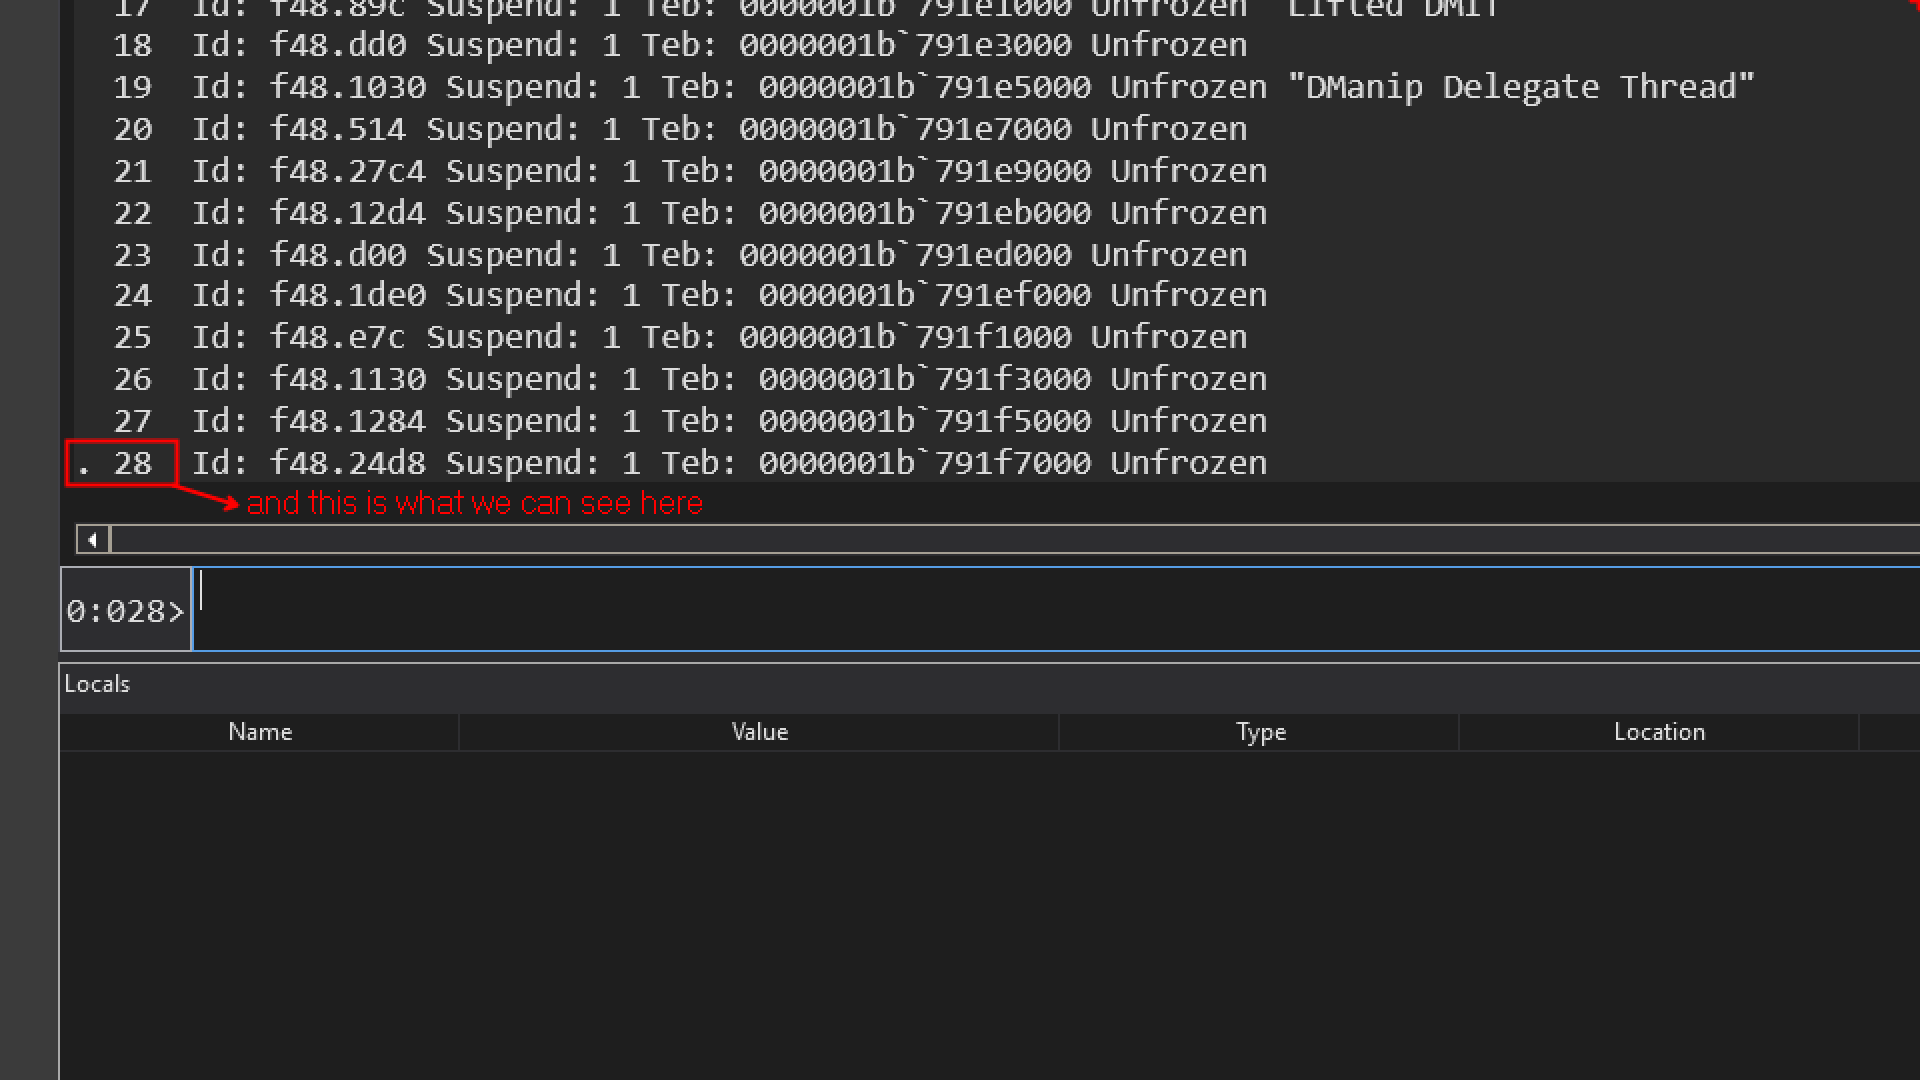
btw guys, i was documenting this earlier and now i am doing this after 1 month, so the thread id will be different on the following images.
Now we can see by default its showing us the TEB for thread id 22, which is the current thread.
~0s → This command will switch to thread 0 and make it the current thread.
s – stands for set/switch
~
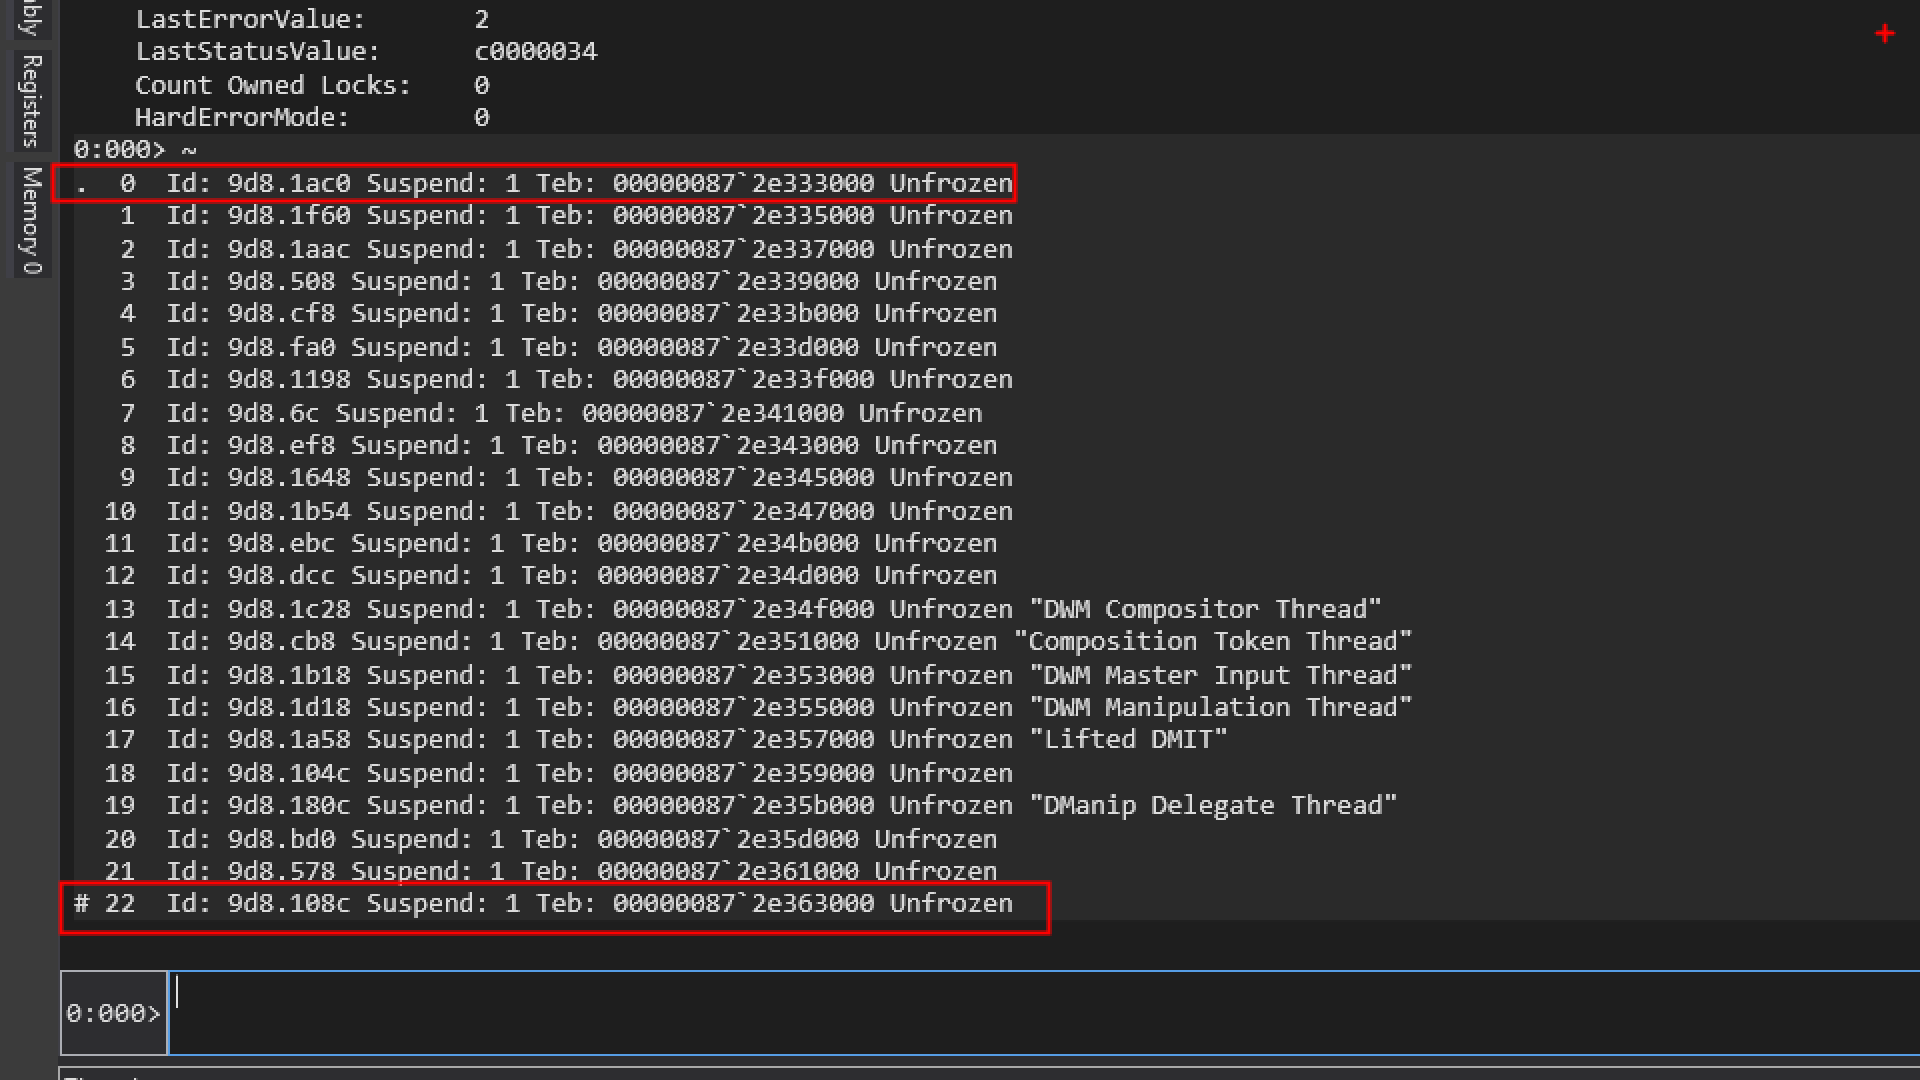
.  0  Id: 9d8.1ac0 ...
...
# 22 Id: 9d8.108c ...
Let us try to understand why this # symbol is there at thread 22.
WinDbg uses two different markers:
| Symbol | Meaning |
|---|---|
. |
Current (selected) thread |
# |
Thread that caused the last debug event (break-in thread) |
. Current thread
This is the thread WinDbg commands operate on right now.
- Registers (
r) - Stack (
k) - Disassembly (
u) - TEB access (
!teb)
All of these command will apply to the . thread.
# Last break-in / event thread
The # marks the thread:
- Where the last breakpoint / exception / debug event occurred
- The thread that caused execution to stop
# 22 Id: 9d8.108c
This means:
Thread 22 is the thread that hit the breakpoint or exception that brought you into the debugger.
Important thing to note:
- Switching threads (
~0s,~22s) ❌ does NOT move# - Only continuing execution (
g) and hitting another breakpoint/exception updates#
What is Dmanip Delegate Thread
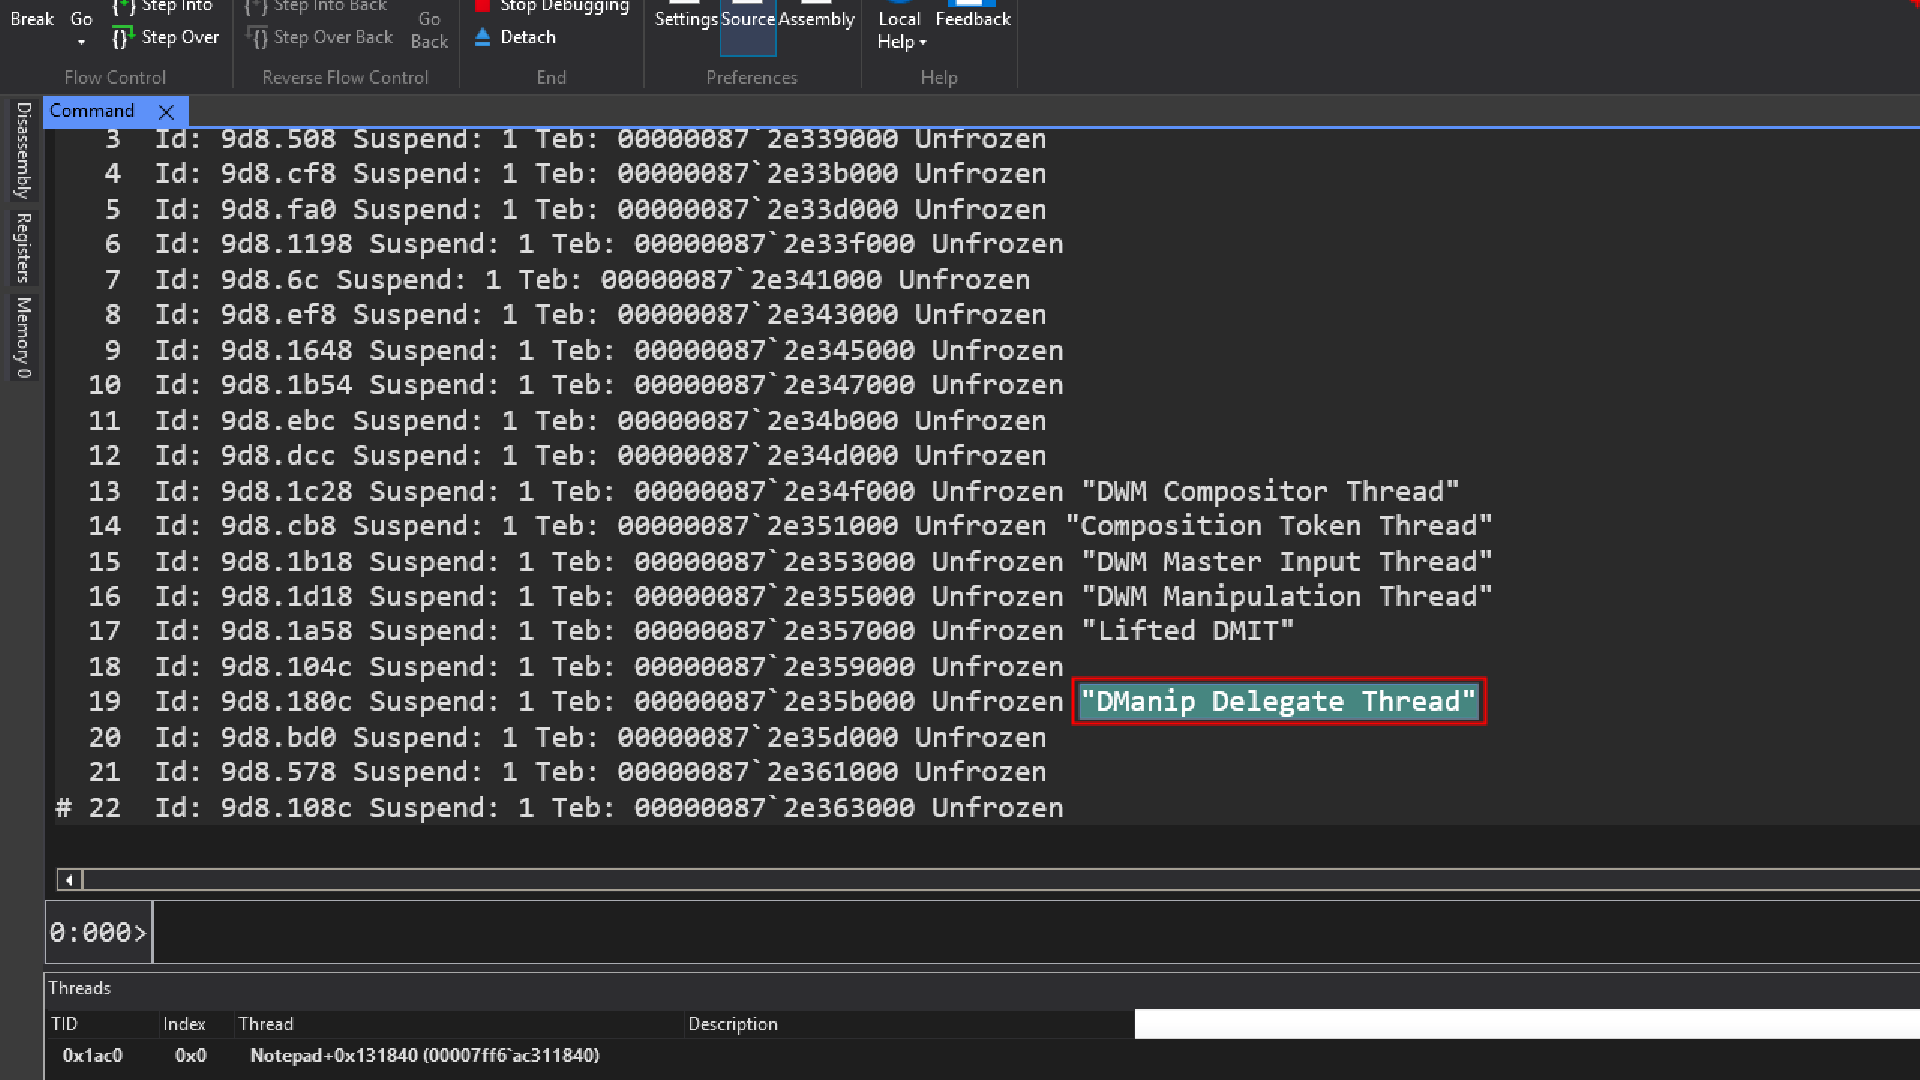
In some cases, we see short thread descriptions like DManip Delegate Thread. This is a supported feature introduced in Windows 10 and later through the Windows API. These descriptions are purely textual metadata and have no impact on runtime behavior. Their sole purpose is to help developers and debuggers more easily identify threads.
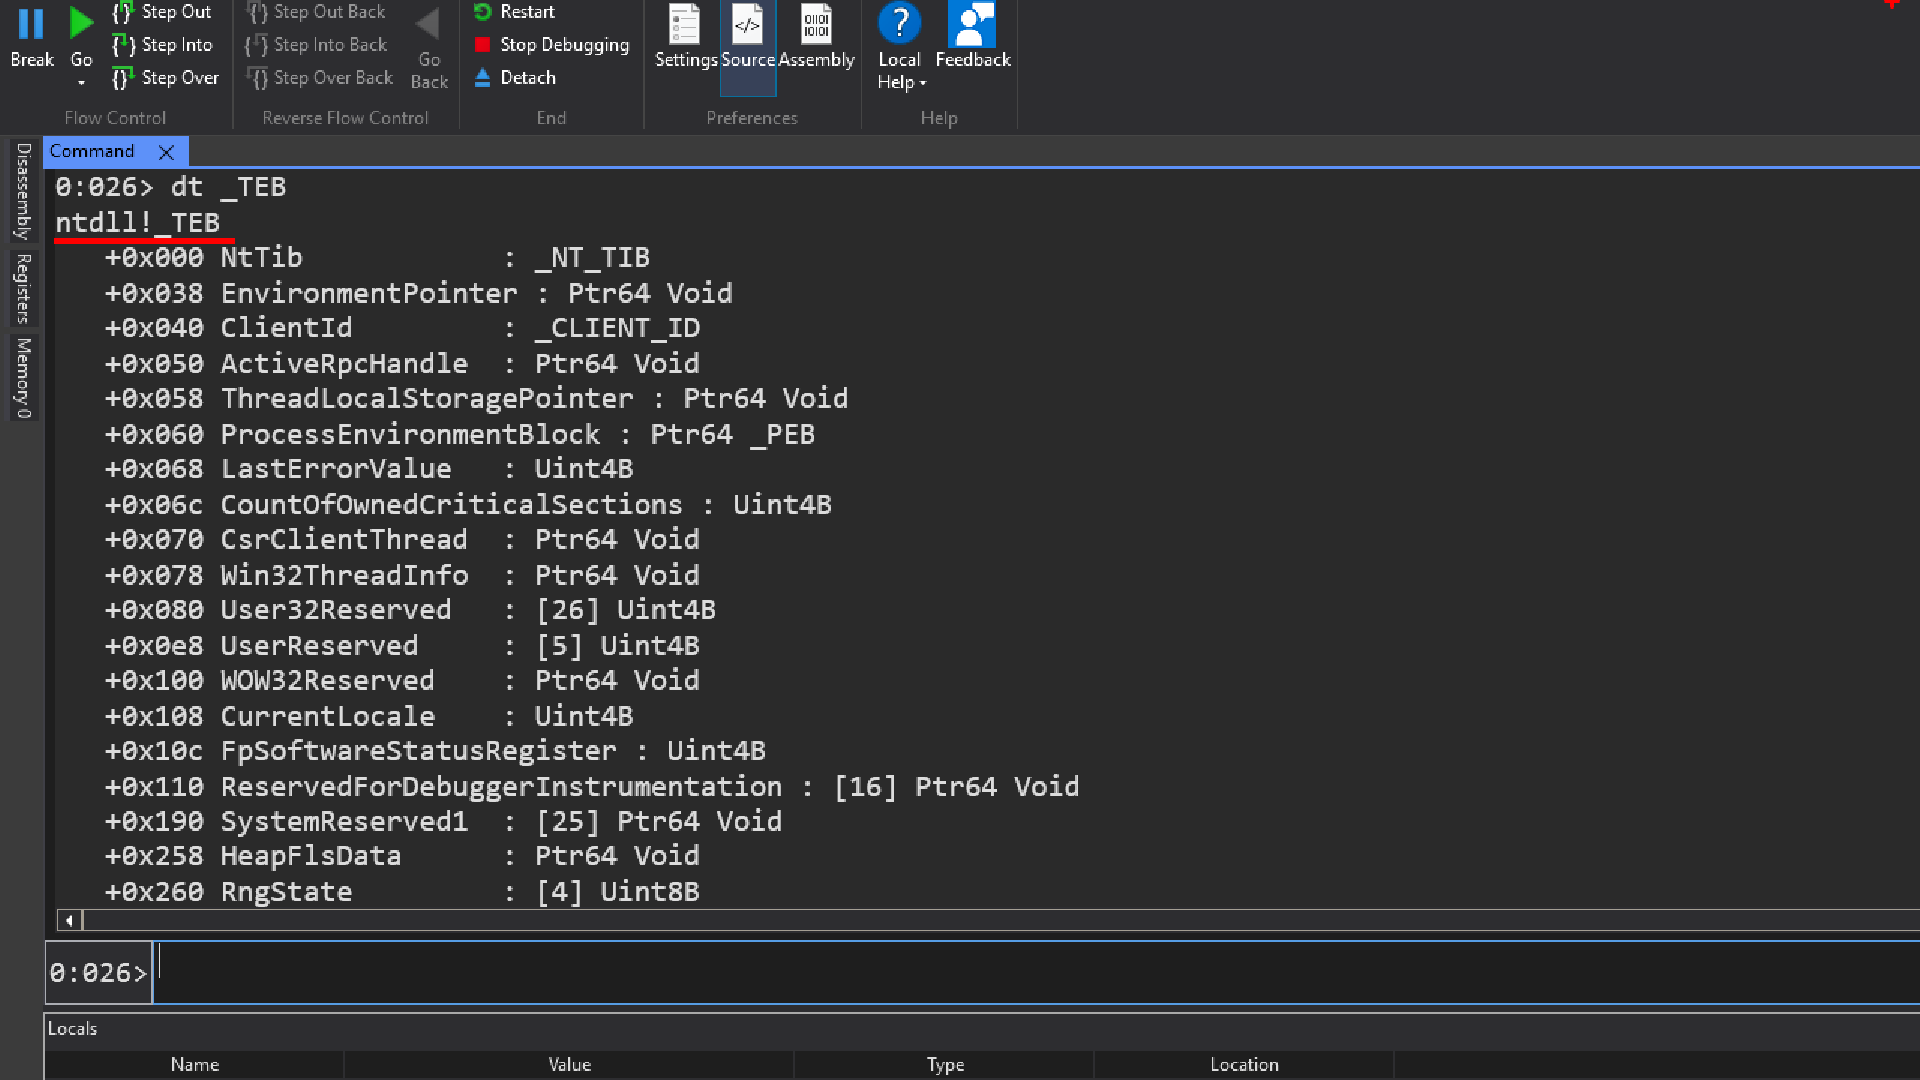
We are able to see the general layout of this data structure at offset 0 theres a data structure called NtTib
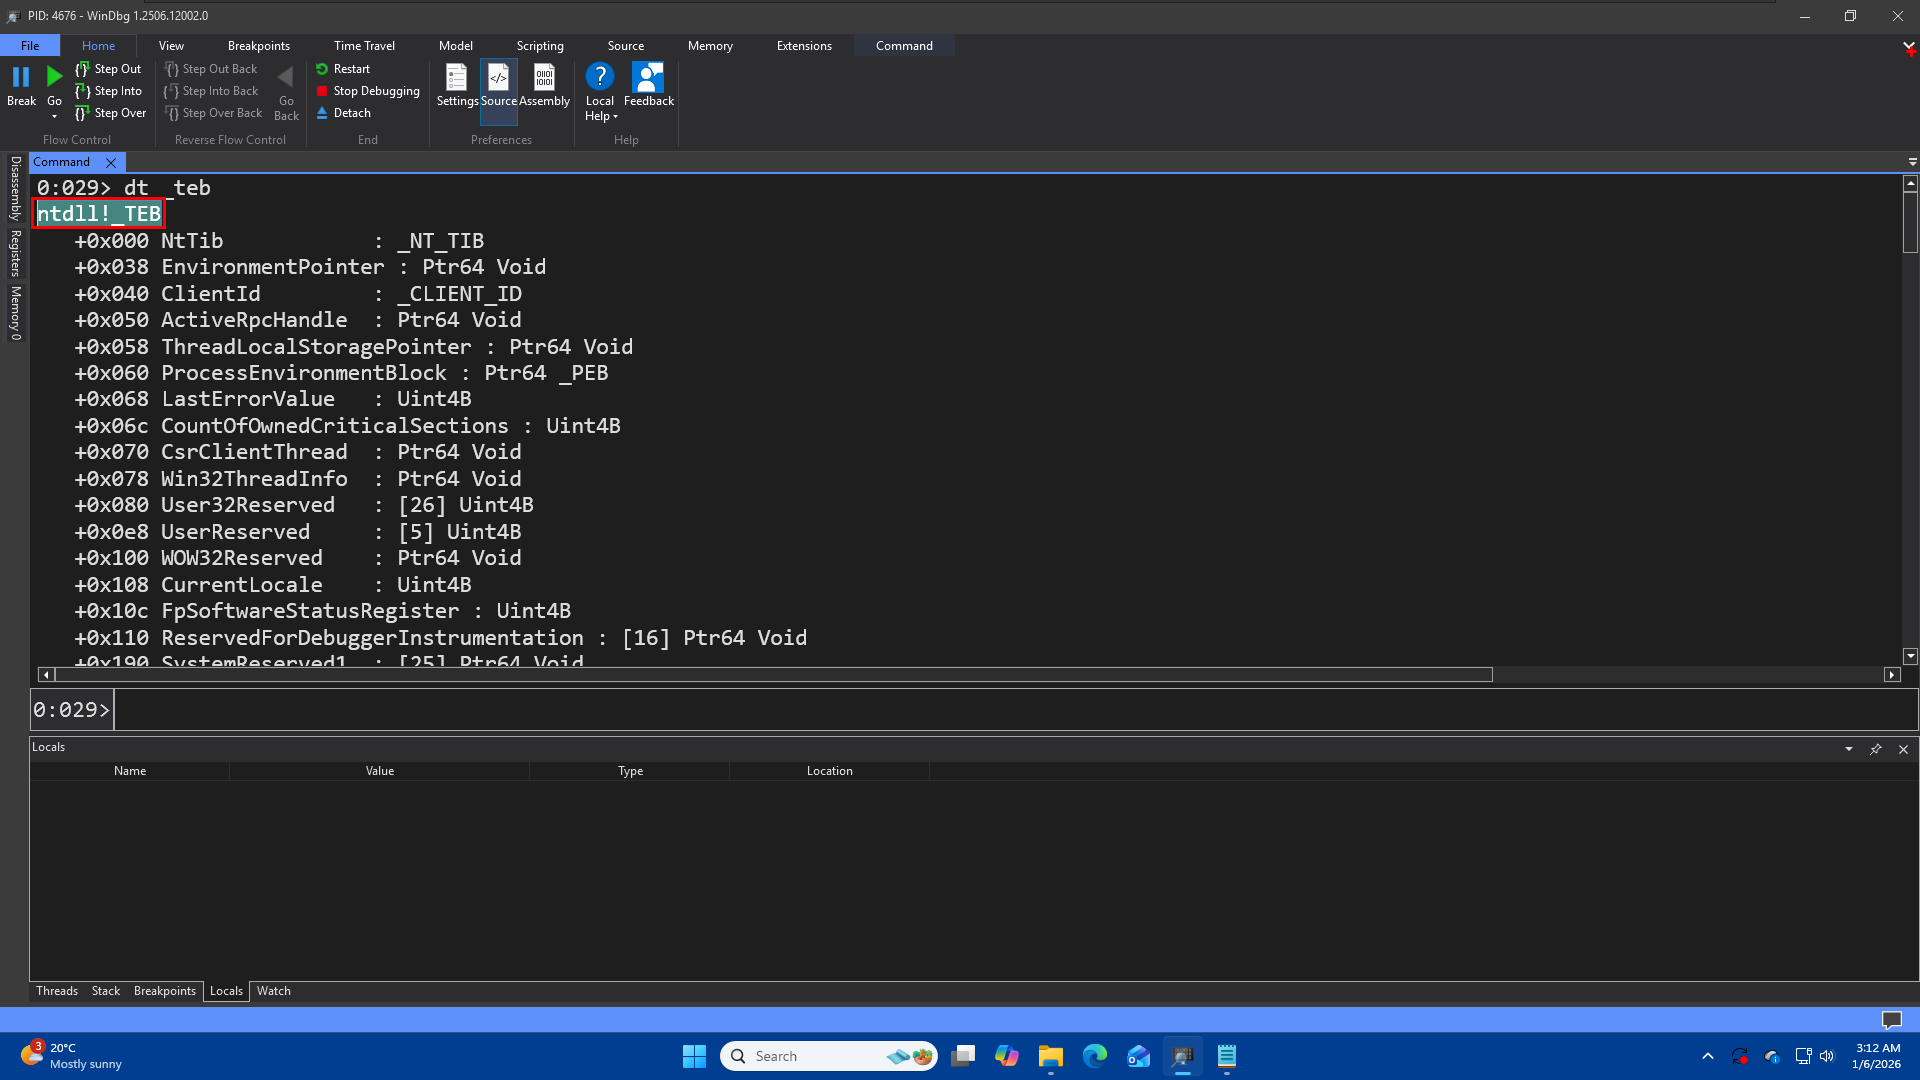 When you type
 dt _teb, WinDbg has to search through the loaded symbol files to find a match. By returning ntdll!_TEB, it is confirming: “I found the structure _TEB inside the ntdll module.”
dt -r ntdll!_TEB
**Recursive Display (** -r ): If you want to see what is inside the nested structures (like opening the NtTib at the top), use the recursion switch.
if we know the module, that where it is defined then thats definetly the best practice to specify the module name too, because in some cases we might have two data structures that has the same name but they are completely different and defined in different modules. So if you dont Provide the module name then the first one which the debugger is able to find is going to be used, which is not necessarily what we want so its always better to put the fullname and full name consists the module name too.
callstack(k)
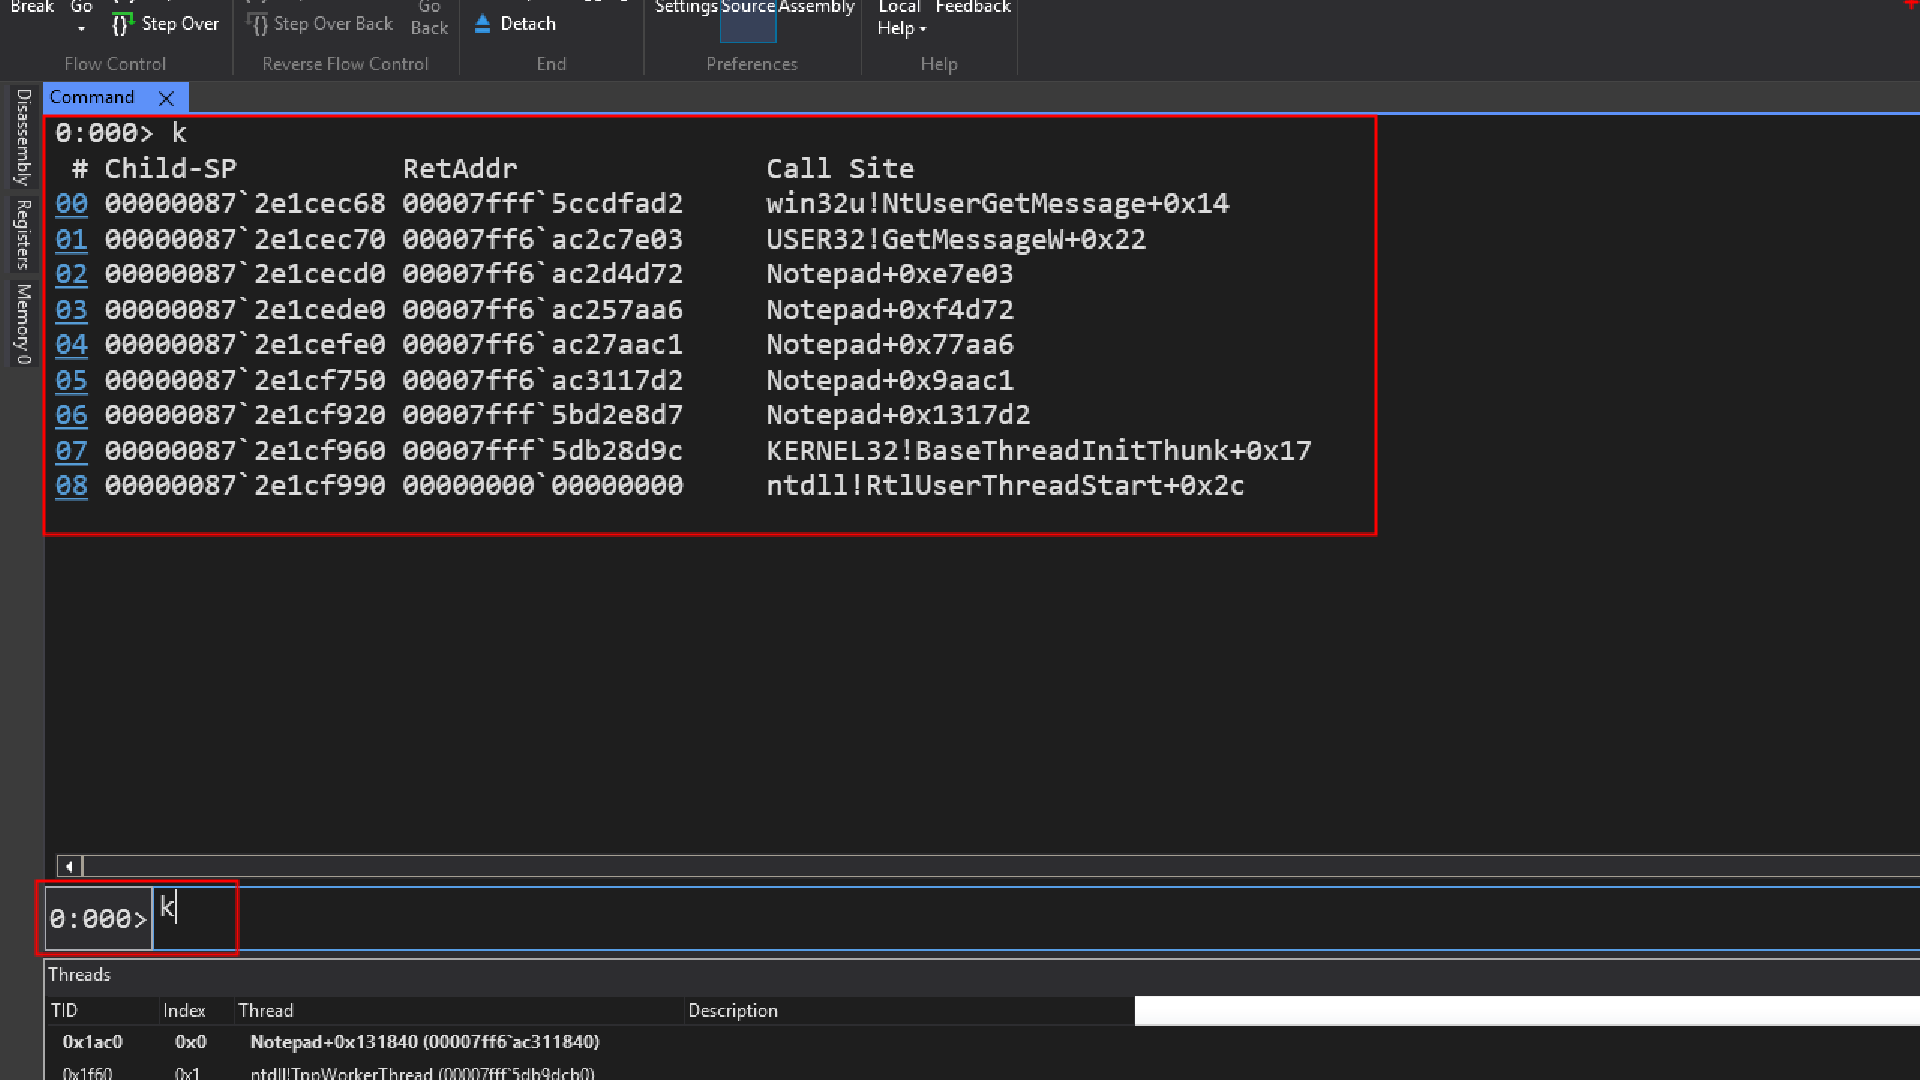
By entering the command “k” we will be able to see the call stack for thread 0, since we did not provided any extra information like for which thread we want to view the call stack, windbg assumed we are asking to print the callstack for current thread which is thread 0 in this case.
What is callstack?
lets imagine a code:
main()
{
    A();
}

A()
{
    B();
}

B()
{
    GetMessage();
}
When execution is inside GetMessage(), the stack looks like:
GetMessage()
B()
A()
main()
The most recent call is always at the top.
Let us try to understand the meaning of the columns highlighted one bye one
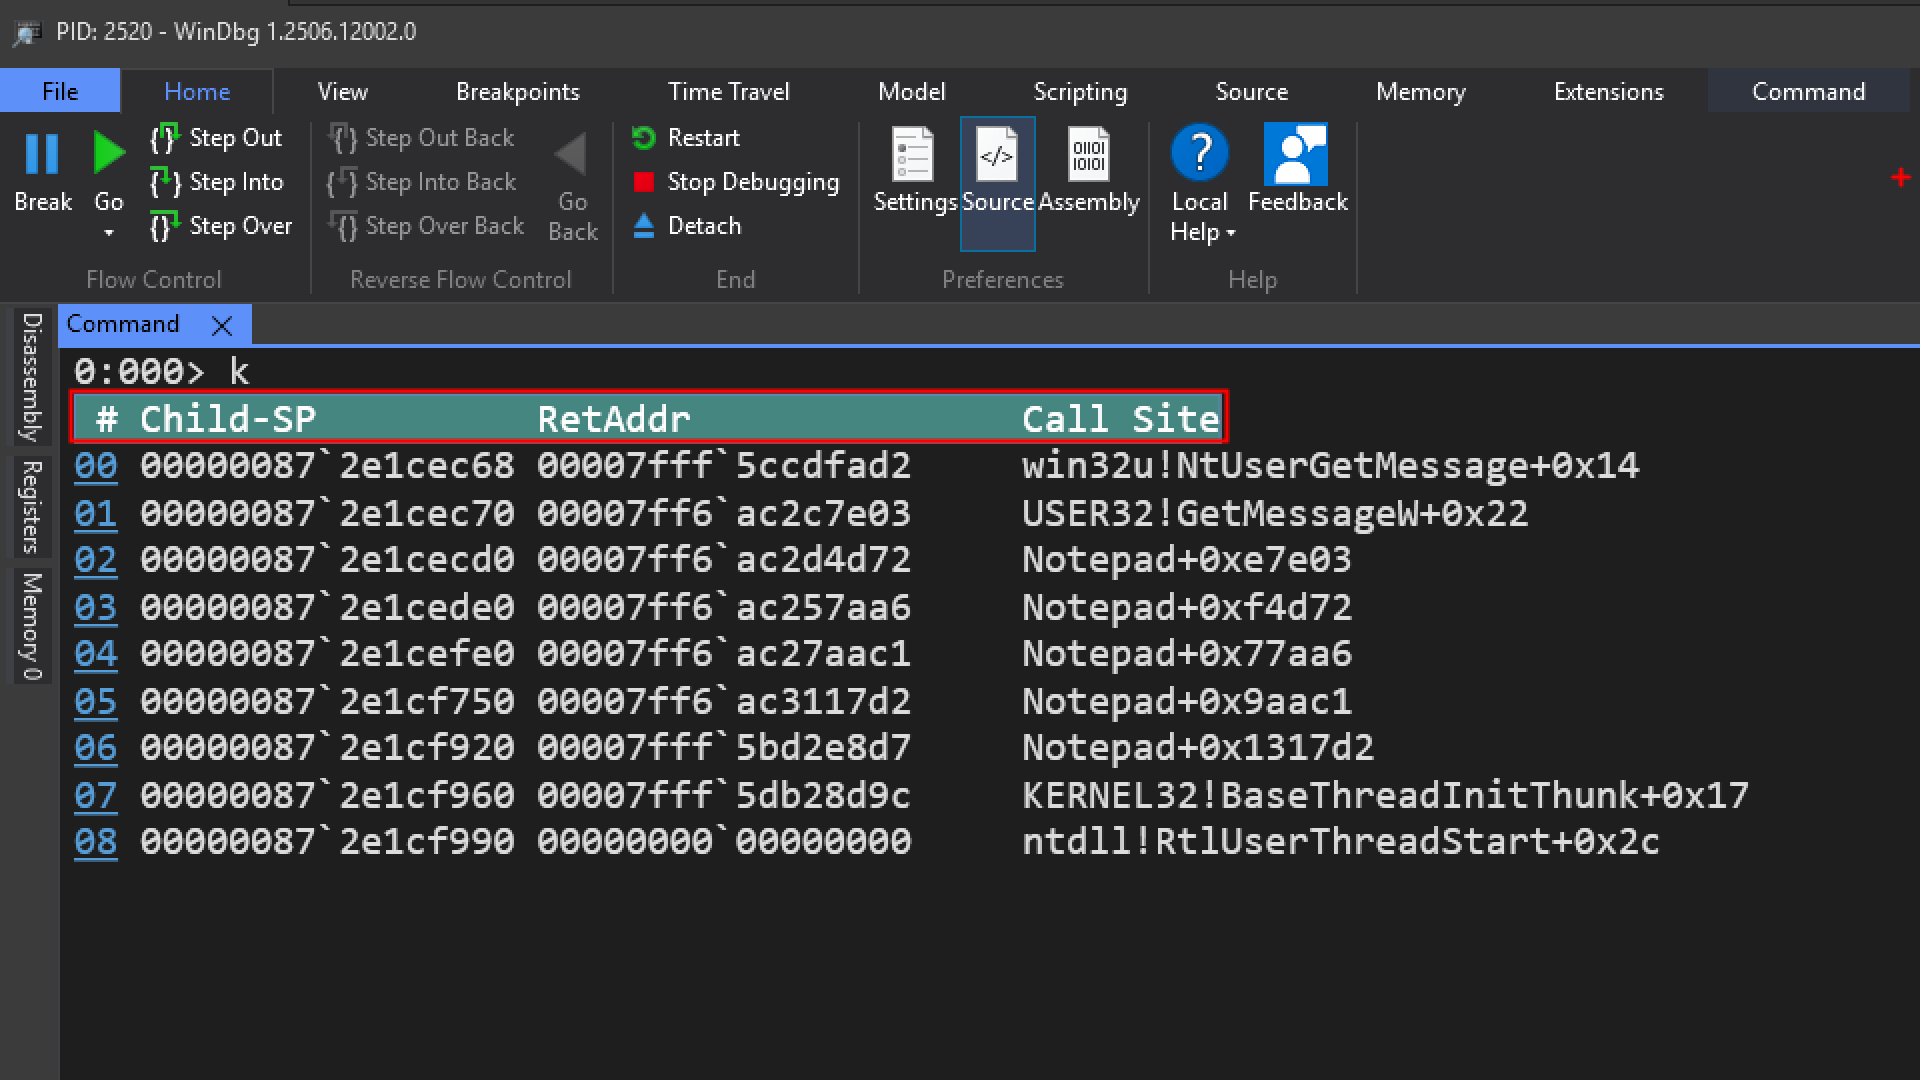
00 win32u!NtUserGetMessage+0x14
01 USER32!GetMessageW+0x22
02 Notepad+0xe7e03
03 Notepad+0xf4d72
04 Notepad+0x77aa6
ntdll!RtlUserThreadStart + 0x2b
-
win32u!NtUserGetMessage+0x14
was called by -
USER32!GetMessageW+0x22
was called by -
Notepad+0xe7e03
was called by -
Notepad+0xf4d72
was called by -
Notepad+0x77aa6
Instead of saying:
Notepad+0xe7e03 is called by Notepad+0xf4d72
It’s more accurate to say:
Execution returned from
Notepad+0xf4d72 into Notepad+0xe7e03
-
Notepad doesnt contain symbols, so we dont get symbols for notepad.exe, all we have is this
Notepad+0xe7e03 Number and we dont have any idea what that function is. -
ntdll!RtlUserThreadStart is the standard and common entry point for user-mode threads on modern Windows operating systems (Vista and later)
Even when you create your own thread and provide a function name, that function is not the first thing that executes on the thread.
Some code runs first in ntdll and kernel32, and only after that is your function called.
~1k – this command will show us the call stack for thread number 1.
~2k – show us the call stack for thread number 2.
~nk – Show us the call stack for thread number n.
~*k – see all the threads with its call stack